The Biggest Opportunity In Crypto

文章目录
The onchain options sector is the largest whitespace and biggest opportunity in crypto today. It's the most compelling sector to allocate capital towards.
When you look at the TAM and size the opportunity, it’s a matter of when, not if, options take center stage. The final evolution of every mature financial market is expansion into options. And crypto has reached this inflection point.
Retail demand is already proven at massive scale in TradFi. And onchain, the binding constraints are no longer regulation or infra. Maker liquidity is improving, RFQ systems allow you to execute size, and competition is multiplying.
As this nascent sector (onchain vols are still just 6.9% of Deribit’s options volume) is heating up, it’s finally primed to take on its ultimate challenge: cracking distribution.
To hit escape velocity, non-toxic (retail) taker flow must be onboarded at scale. Because historically, retail was the main driver behind every options market that experienced runaway growth.
Note: This is an excerpt from the upcoming onchain options research report. It’s incomplete and covers only the gist of one section.
How Options Trading Hits Critical Mass
Ironically, the most persistent (and most incorrect) claim you hear spouted on CT is: “retail doesn’t understand options, so they will never trade them onchain.”
Horrible take because all evidence points to the opposite. Does it take time to comprehend the greeks and the payoff structure? Absolutely, but complexity of pricing theory doesn’t diminish insane product demand.
Retail punts options because the profit potential is easy to understand. Nobody calculates theta decay.
When access isn’t limited and UI sleek, retail trades options at outrageous scale. "Convexity" is what makes options such an attractive trading instrument, colloquially known as maximum profit being unlimited.
In reality, options are retail traders’ favorite derivative. For the non-believers, please consult the exhibits below:
Exhibit A: U.S. Options contract volume more than tripled since 2017, driven by retail.
No need to look further than the U.S. Prior to and between 2014 and 2017, institutions dominated options volume. As a result, growth was stagnant, hovering around 4B annual contracts traded.
Retail participation was negligible.
In December 2017, Robinhood launched commission-free options and many brokers followed suit. Then COVID hit and the stars aligned.
Everyone was stuck at home, waiting for things to reopen and life to continue. Asset prices cratered on the initial COVID news and everyone turned to investing.
Drumbeat marketing coupled with newfound retail interest in finance conjured up the perfect storm. Retail onboarded to finance apps at scale, and options volume followed suit.
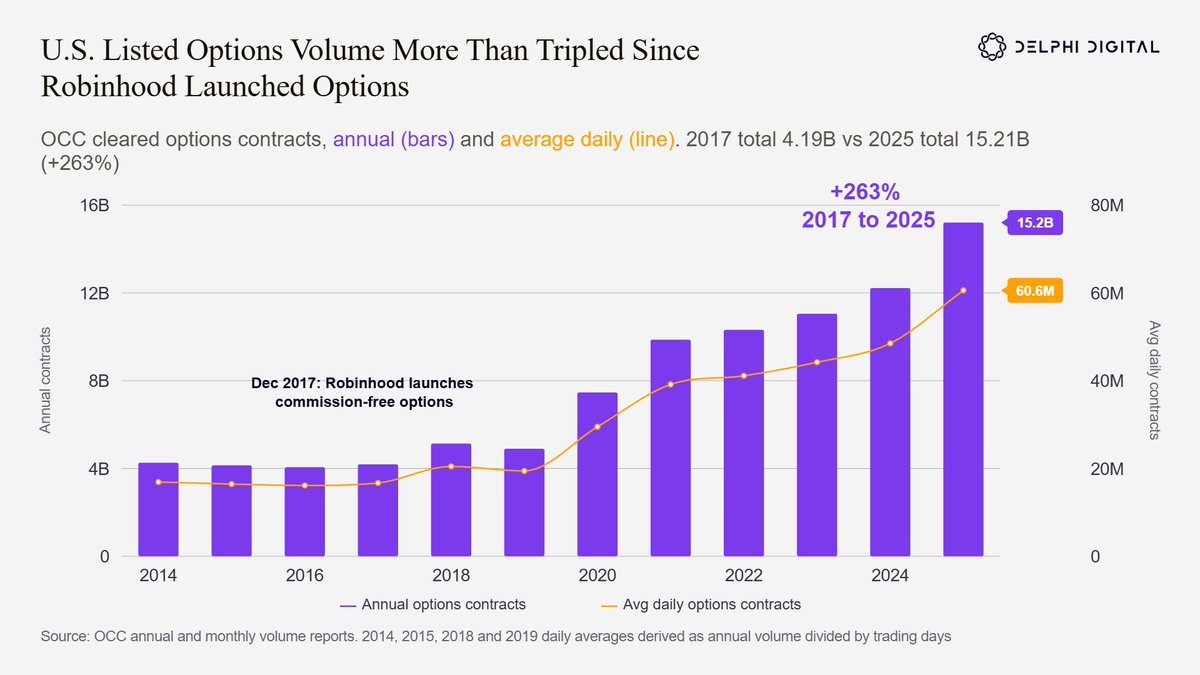
From 2017 to 2025, annual option contracts traded more than tripled, increasing +263% from 4.19B to 15.2B. Institutions ramped up volume as trading increased, market makers needed to hedge more, and everyone wanted convexity. The main driver was retail adoption.
Exhibit B: Same-day Options’ Share of S&P 500 Options 12x’d in a Decade
The influx of outsized retail participation is also evident in the shift towards short-dated options trading. Retail loves convexity, and the shorter-dated an option is, the more upside it offers when volatility spikes.
The furthest you can go out on the risk curve in options trading is zero-days-to-expiration (0DTE) options. They expire and cease trading at the end of the same trading session (any option becomes 0DTE on its last trading day, fyi).
Over the past decade, retail demand has not only accelerated, but same-day contracts have also become available more often. Retail behavior across the globe is synced, with the 0DTE – 3day expiries being the most traded contracts.
Institutions don’t opt for these lottery-ticket-type trades, making short-dated contract volume an excellent gauge of retail participation.
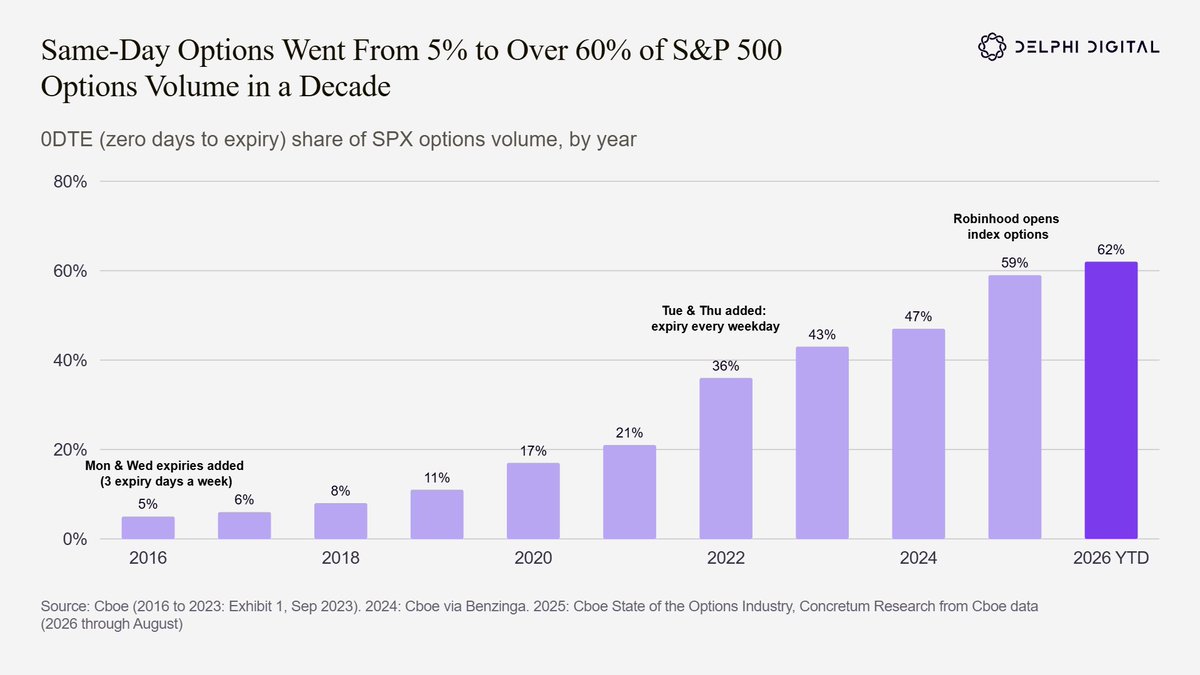
In the last decade, same-day options have more than 12x’d, growing from 5% to over 60% of all S&P 500 index (SPX) options volume.
SPX options have had weekly Friday expiries since 2005. Cboe added Monday and Wednesday expiries in 2016, and Tuesday and Thursday in 2022, which created an expiring contract on every trading day.
Each supply expansion was met with more demand.
When Robinhood opened index options to all its customers in January 2025, Cboe credited it with the following month’s jump to a then-record 56%. It’s the same pattern across the globe: give retail cheap, short-dated contracts, and they trade them en masse.
Exhibit C: Short-Dated Options Have Taken Over S&P 500 Options Trading
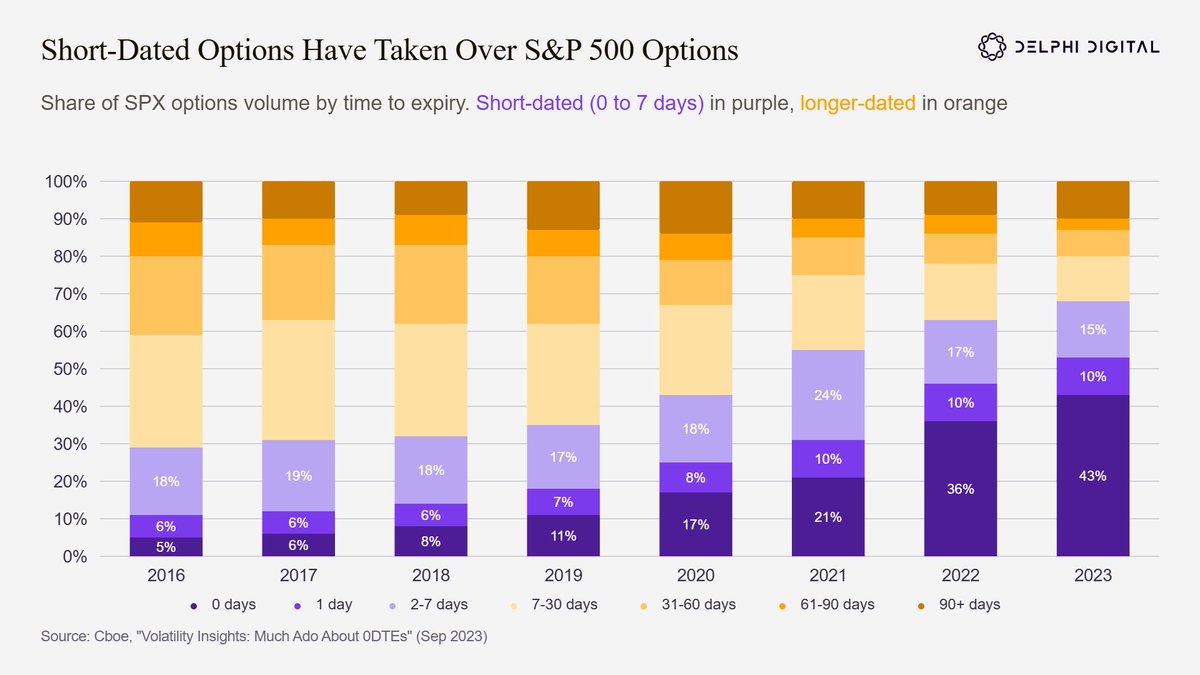
The shift goes well beyond same-day contracts. Across the S&P 500 options market, the whole distribution of trading has moved towards the very short end.
In 2016, options expiring within a week made up 29% of S&P 500 options volume. The largest single group was options one week to one month from expiry, at 30%. Contracts with more than a month left accounted for 41%.
By 2023 the picture had flipped completely, expiry:
-
Within a week: 68% of volume, led by same-day options at 43%.
-
One week to one month: down to 12%.
-
More than a month: down to 20%.
In seven years, S&P 500 options went from a market dominated by multi-week positions to one where two out of three contracts expire within days.
Again, retail drove this shift. In 2023, SSRN published a study showing that, for retail, same-day contracts are pretty much the whole product: "more than 75% of retail trades in S&P 500 options are 0DTE."
Exhibit D: Options consistently make up Robinhood’s largest transaction-based revenue line.
Everyone has heard of Robinhood. The majority of US retail trading in financial markets happens on mobile apps, with Robinhood leading the pack.
Options dominate Robinhood’s balance sheet as the biggest txn-based revenue item. And unlike crypto revenue (which is very cyclical), options consistently take the top spot in Robinhood's revenue.
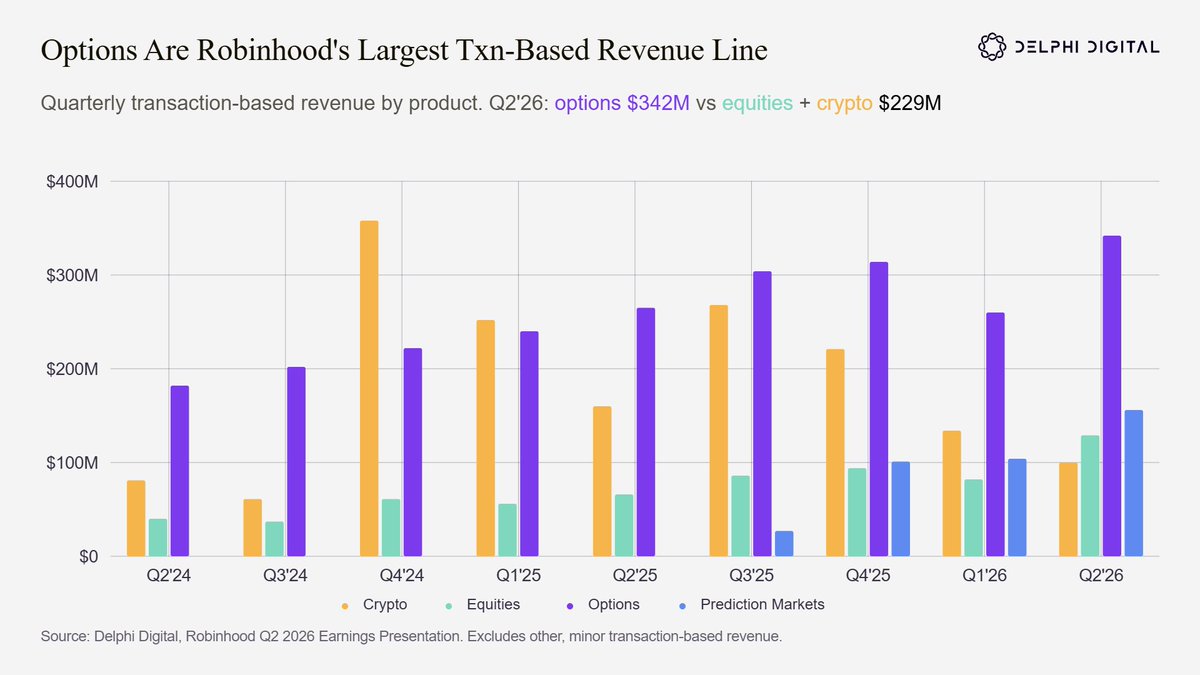
The dominance is so stark that options trading regularly pulls in more revenue than equities and crypto combined.
Most recently in Q2 2026, options pulled in $342M for the quarter while equities plus crypto made “just” $229M. Revenue growth is also up and to the right, with a healthy two-year increase of +88% from $182m in Q2 2024 to $342m in Q2 2026.
Exhibit E: Indian Retail Dominates Options Trading Globally
No retail cohort has embraced options like Indians. Globally, Indians are the undisputed options chads, making them an outstanding case study.
Quick housekeeping before we dive in. Options trading analytics has two major metrics: premium and notional volume.
-
Premium: The cash actually paid for options. If you buy a call for $200, that’s $200 of premium. It’s the money that genuinely changes hands, making it an honest measure of how much business a venue is doing.
-
Notional: The face value of what was traded, contract size multiplied by the underlying's price. A $200 premium might control $10,000 of exposure, so notional numbers can look large even when little money moves. Useful for scale, bit misleading on its own.
Back to India.
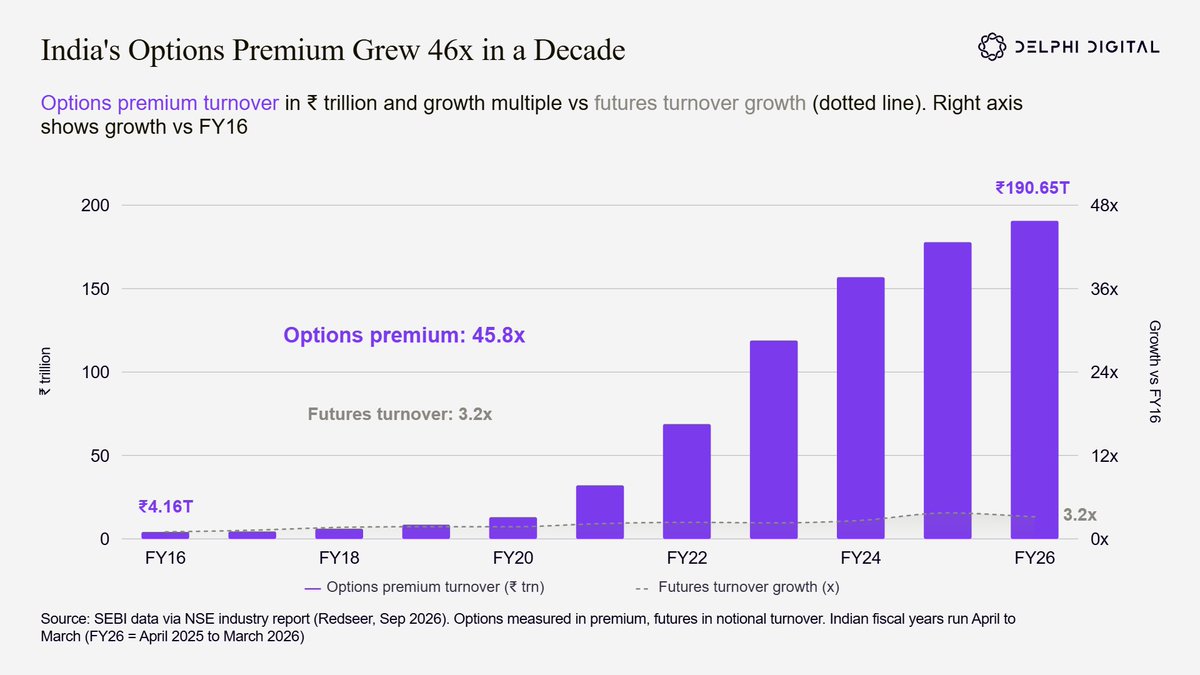
In fiscal 2016 (April 2015 to March 2016), Indian traders paid ₹4.16 trillion lakh in equity options premium. By fiscal 2026, premium turnover reached ₹190.65 trillion, a 45.8x increase.
In late 2024, the Securities and Exchange Board of India (SEBI) introduced several regulations, including tripling the minimum contract size from ₹5 to ₹15 lakh and requiring exchanges to offer weekly expiry for only one benchmark index.
Despite that, options premium keeps rising, up another 7% in fiscal 2026.
Among Indian retail derivatives traders, options are the clear favorite.
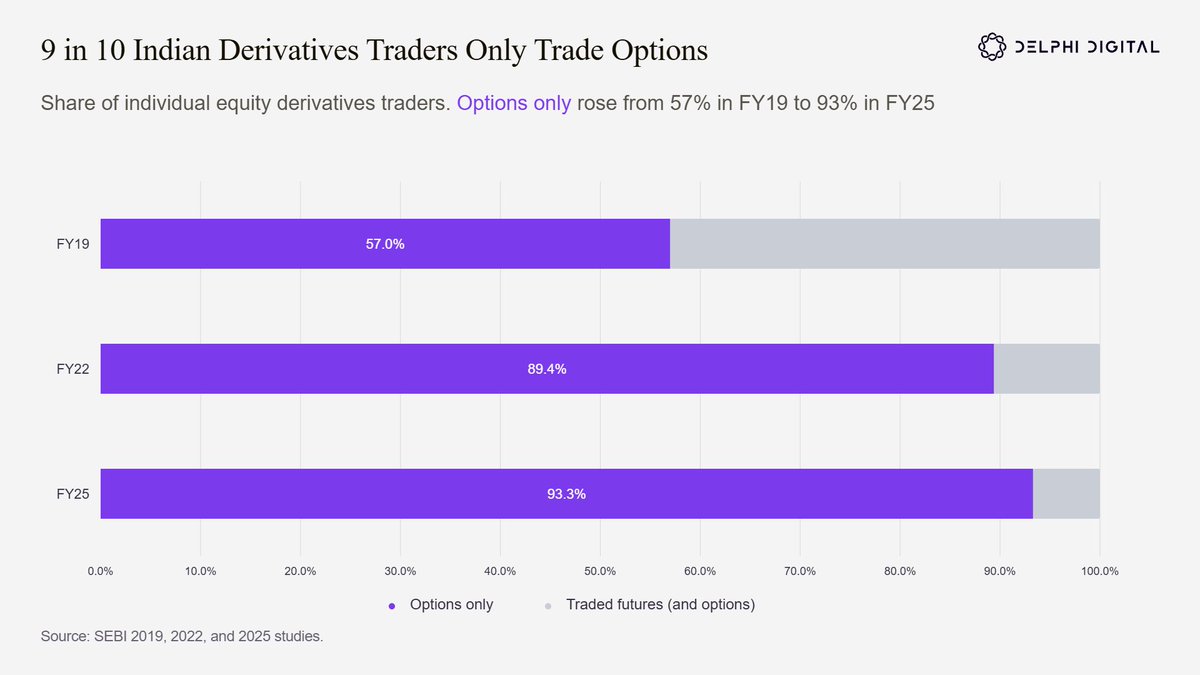
More than 9 out of 10 retail derivatives traders punt options only. Fair to say that for Indian retail, derivatives trading is synonymous with options trading.
Before drawing a global comparison, it’s worth being precise about what India’s dominance means. In the first half of 2026, Indian exchanges traded 39.3 billion options contracts, 4.5x the 8.7 billion traded across all US options exchanges.
Yet US traders paid $6.3 trillion in premium, nearly 5x India’s $1.3 trillion. That works out to roughly $33 of premium per Indian contract versus $719 per US contract.
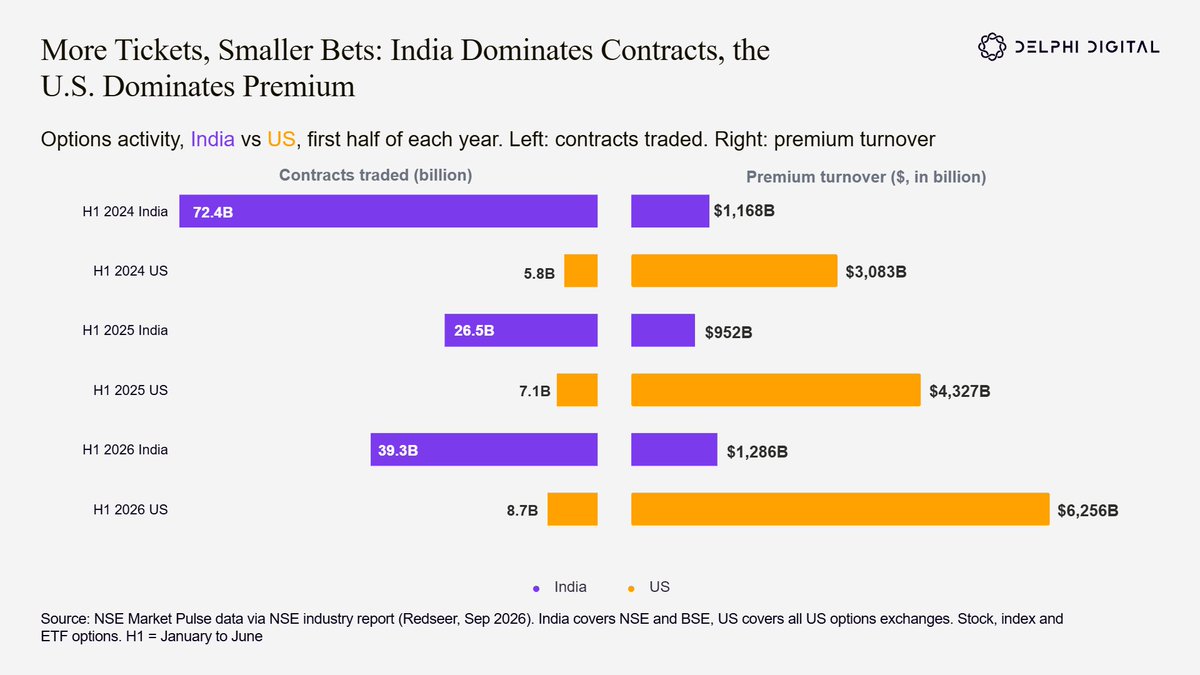
The difference comes down to smaller minimum contract sizes and what Indians trade. Indian volume is almost entirely index options, cheap contracts with small minimums that expire within days. But US volume includes single-stock and ETF options and longer-dated contracts that carry much more premium.
Indian retail is buying similar lottery-ticket-style options like US retail, just more cheaply.
In this visual, we also see the effect of SEBI’s regulation better. Indian contracts traded fell 63% between H1 2024 and H1 2025, but premium fell only 18%.
Much of the drop was in bigger contracts rather than traders leaving. By H1 2026, contracts were back up 48% and premium 35%.
With that context, let’s look at global contracts traded and slot India’s place into the picture.
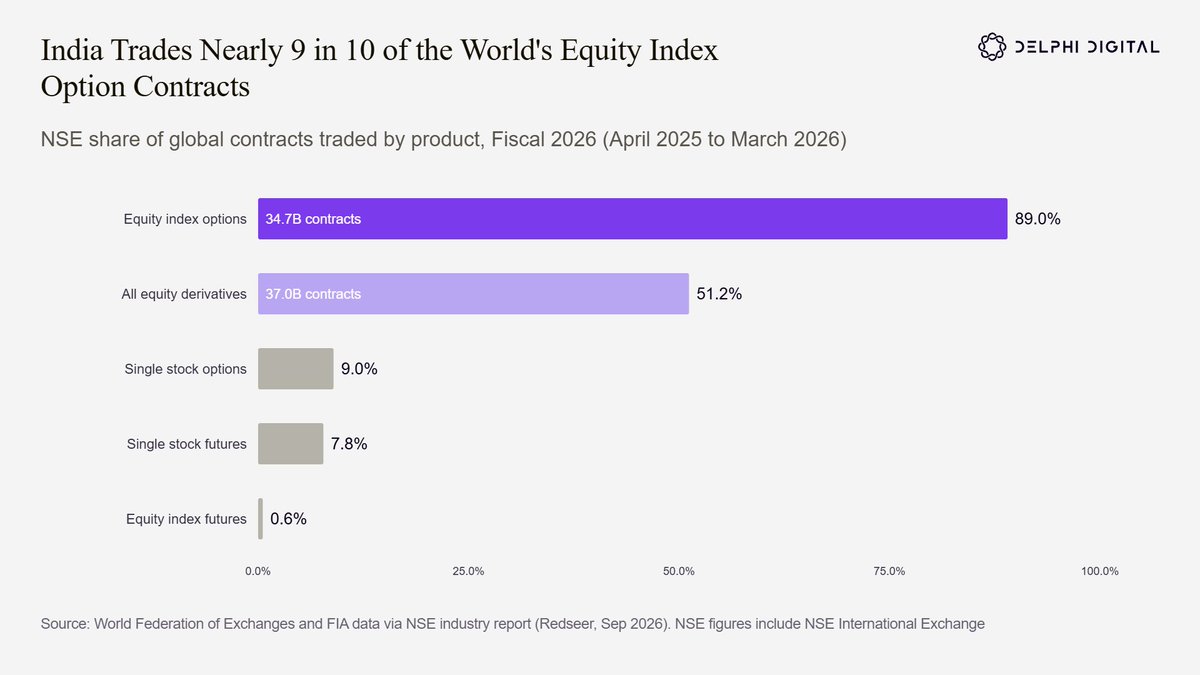
Take it with a grain of salt but by pure participation, India dominates global options activity.
In fiscal 2026, NSE traded 34.7 billion equity index option contracts, 89% of the world’s total, and 51% of all equity derivatives contracts traded anywhere. That dwarfs the West’s biggest derivatives exchanges (on contracts traded only).
For comparison, contracts traded in that timeframe are ~7.1B on the CME and ~5B on the ICE. NSE is 4.9x and 6.9x larger, respectively.
Indian retail didn’t just adopt options, it’s the country’s main way to trade markets.
Exhibit F: Korean Equity Options, The Chronicle of an Empire
Long before India, Korea showed what happens when retail gets easy access to cheap index options.
KOSPI 200 options, which track Korea’s 200 largest listed companies, make up the vast majority of KRX equity options.
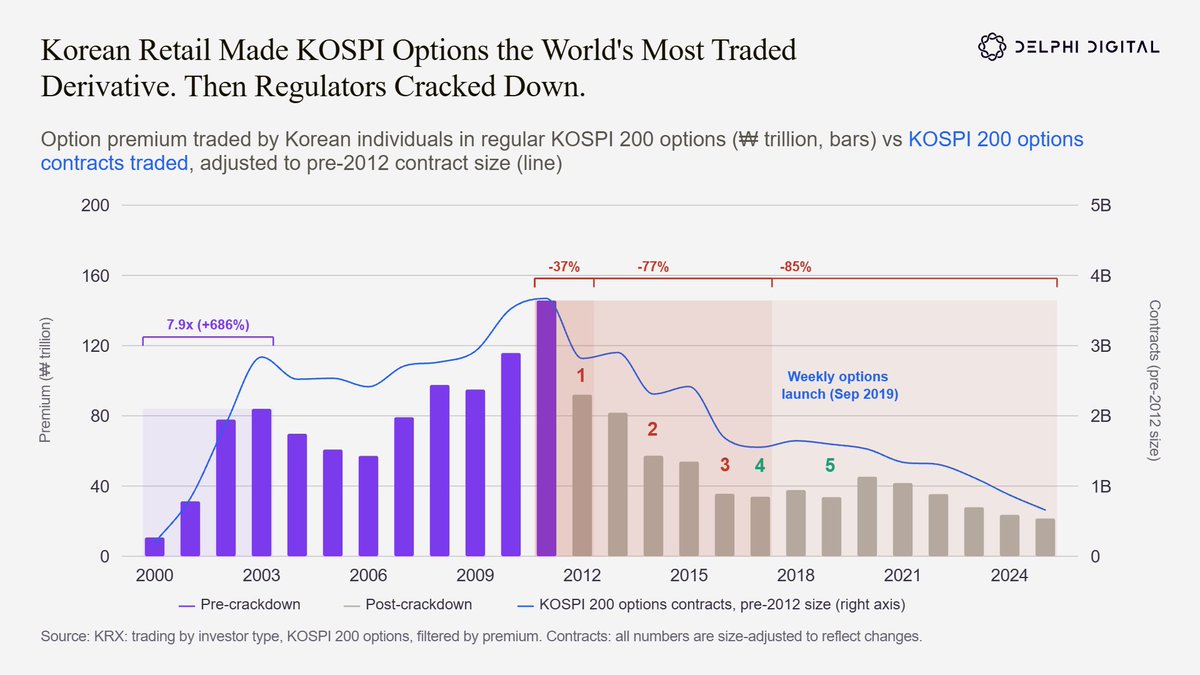
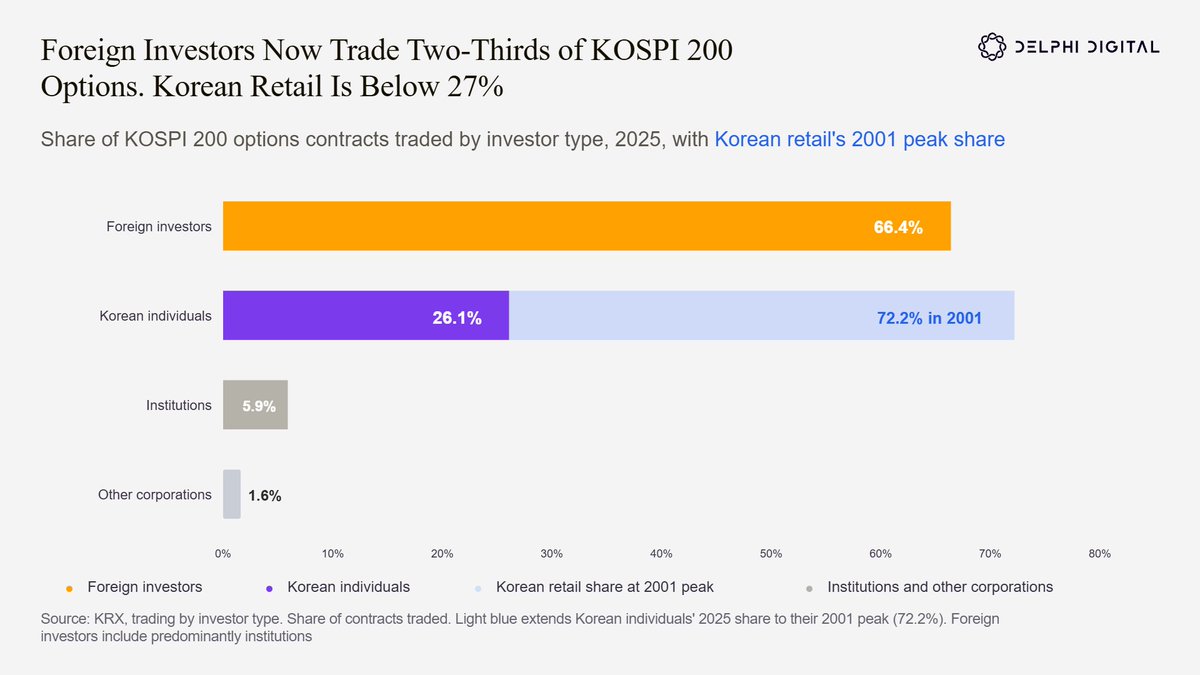
In the early 2000s, domestic retail made up 70% of all KOSPI options trading activity. As foreign institutions and foreign retail entered the market and regulators cracked down domestically, Korean retail participation cratered to under 30%.
And to this day, retail participation has not recovered.
Korea’s equity options market speed ran the empire arc. The trajectory began with a rapid ascent, followed by global dominance and an abrupt decline driven by harsh regulation.
There’s a lot to unpack and learn here, so let’s go step by step.
- The Boom: 2000 – 2003
Total equity option contracts traded rose from 194 million in 2000 to 2.84 billion in 2003, a quick 14.6x increase in the span of three years.
Zooming in on retail, premium traded by individual investors surged 7.9x over the same period. Retail investors clearly drove this boom, accounting for 70% of all KOSPI 200 options trading.
- The Global Dominance: 2004 – 2011
By 2004, KRX equity options made up ~28% of all derivatives contracts traded worldwide. For nearly a decade, this Korean option derivative sat at the top of FIA’s global contract volume rankings, peaking at 3.67 billion contracts in 2011.
Retail options premium peaked at ₩145.7 trillion.
- The Downfall: 2012 – 2017
Eventually, the government brought down the regulatory sledgehammer on what was seen as excessive retail speculation.
In December 2011, the FSC announced that the KOSPI 200 options contract would become five times larger, raising the multiplier from ₩100,000 to ₩500,000. For reference, 1 USD = 1327 Korean Won, so the min. multiplier increased from ~$75.34 to ~$376.71 at today’s exchange rate.
This change (1 in the chart) was phased in between March and June 2012. Total contracts traded fell -23% from the 2011 peak. Retail premium cratered even more, dropping -37% YoY.
Then regulators swung for the fences in December 2014 (2): new retail traders needed 30h of education, 50h of mock trading, and deposits of ₩50 million ($37,671!!!) before they could participate in options trading.
This almost entirely killed growth in new retail users.
In January 2016, regulators enacted the third and final crackdown. Contract volume declined again after regulators doubled capital gains taxes (3) on KOSPI 200 derivs from 5% to 10%.
By 2017, contract size-adjusted activity was down -57% and retail options premium was -77% below their 2011 peaks.
In the following years, regulators eventually conceded they had gone too far. In March 2017, they halved the contract size (4) to ₩250,000. In 2019, the FSC described its own entry barriers as “excessive”, cutting deposits (5) to ₩10 to 20 million and reducing training to 1h of education and 3h hours of mock trading.
In 2019, the FSC also launched weekly KOSPI 200 options in an effort to revive the market. Activity recovered to some extent, crawling back up to 1.7 to 2.0 billion size-adjusted contracts a year between 2020 and 2025, still -50% below the 2011 peak.
So regulation didn’t kill the KOSPI 200 options market outright, but certainly slashed retail participation. Retail options premium made a new 20-year low in 2025, sitting at just ₩21.5 trillion. Compared to the 2011 peak, a decline of -85%.
The damage to domestic retail participation seems irreversible. To this day (Q4 2026), retail participation sits below 27%, foreign institutions (and individuals) make up over 66%.
“Sensible” regulation had the intended effect, right? Excessive speculation slowed down, investors were protected, and demand fizzled out…
Yeah, nope.
As with any flourishing market facing excessive constraints, demand moved offshore.
Korean traders simply switched to offshore futures and options. The appetite for leverage never vanished.
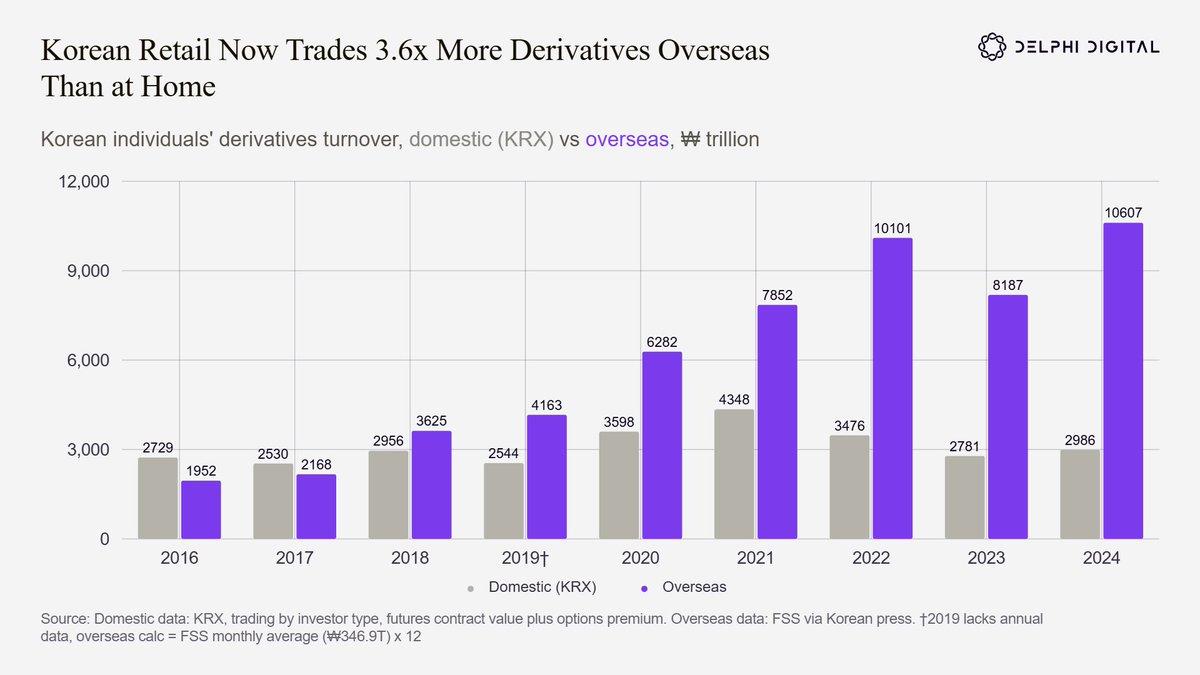
(FSS and KOFIA didn't publish overseas turnover data before 2016, so we have to focus on 2016–2024 for a direct comparison)
Derivatives turnover here refers to the total value of everything Korean individuals traded in the derivatives space in a year. It includes futures and options.
On the futures side, turnover counts the full value of the position traded, so the entire contract value (the index price × the multiplier × the number of contracts). For options, only premium paid is counted (not the notional value of the position it controls).
In 2016, Korean retail still traded more derivatives at home than overseas: ₩2,729 trillion on KRX against ₩1,952 trillion on foreign exchanges. In 2018, overseas had overtaken domestic turnover for the first time.
And by 2014, the gap became a chasm: ₩10,607 trillion traded overseas against ₩2,986 trillion at home, 3.6 times as much.
Over those eight years, retail’s overseas trading grew 5.4x while its domestic trading rose just 9%.
At home, new derivatives traders still face a minimum deposit of ₩10 million plus mandatory training. Abroad, brokers require no deposit or training.
To no surprise, retail is fleeing a domestic market riddled with high regulatory barriers for overseas venues with little to none. Overseas, Koreans mostly punt US index futures with E-mini Nasdaq 100 futures leading turnover.
History Does Not Repeat Itself, But It Rhymes
Obviously, retail loves trading options. Dissecting global demand matters because history lessons lay the foundation for my take on distribution.
-
Historically, retail is the main driver behind every options market that hit escape velocity
-
Regulation kills local trading activity but NOT demand
-
Across all trading instruments, options are retail’s favorite by a huge margin
India and the US are great case studies, but Korea stands out for a few reasons.
When it comes to onchain options, many dissident voices say that DeFi will never be able to compete with Robinhood in the retail sector. While I disagree for a few reasons, U.S. retail doesn’t need to be onboarded at all (!!!) for the onchain options sector to explode.
Like Koreans, many traders are turning to offshore venues to satisfy their trading demand. Any permissionless protocol is well positioned to capture this demand if it leverages the right distribution channels.
Given how nascent onchain options volumes are, they can easily 10x as we continue onboarding institutions and crypto-native traders. But just like we saw in TradFi, the tipping point for mass adoption will come from regular retail flow.
So how do we crack onchain distribution? How can we onboard taker flow at scale? Why haven’t onchain options taken off yet? And most importantly, which projects are best positioned to win the onchain race?
We’ll answer all of these in our full report. Stay tuned :)
Milady