Trade the Time, Not the Chart: A Beginner's Guide to Time-Based Trading
文章目录
Most new traders start by learning shapes: flags, wedges, head-and-shoulders, fair value gaps. Then they spend months wondering why the same pattern works on Tuesday and fails on Thursday. The missing variable is almost always time.
Markets don't move at random intervals. Large moves cluster around scheduled economic releases, and the broader trend tends to turn on a fairly regular cycle. A trader who knows when a move is likely can be patient for the rest of the week. A trader who only knows what a setup looks like will take every one of them.
This guide covers the minimum toolkit and framework for trading this way. It draws on concepts popularized by the Inner Circle Trader (ICT) community, with timing put first.
The only two tools you need
- TradingView, with real futures data
TradingView is the standard charting platform, and its free tier is enough to learn the interface. For serious analysis, pay for real-time exchange data on the index futures: ES (E-mini S&P 500), NQ (E-mini Nasdaq 100) and YM (E-mini Dow).
The reason is accuracy. Broker feeds and CFD prices are derived from the underlying market and can differ by spread, session hours and the broker's own pricing. Futures data is the source. When your analysis depends on exact highs, lows and timing, you want the source. Crypto traders should apply the same logic and use CME Bitcoin, Ether and XRP futures alongside spot charts. Add DXY, EUR/USD and GBP/USD as well, so you can track all three market triads covered below.
- Forex Factory
Forex Factory's economic calendar lists every scheduled release for the week, rated by expected impact. It is free, and it is the single most useful timing tool a retail trader has.
Set the filter to USD and high impact (red) only. Index futures and the dollar respond most to US data such as CPI, the jobs report (NFP), GDP, PCE and FOMC decisions. Other currencies can be added later if you trade them.
That is the full toolkit. Notably absent: indicators. More on that below.
Read the calendar as a schedule, not a warning
Many beginners are taught to stay flat around red-folder news. That advice protects you from volatility, but it also keeps you out of the moves that matter. A better way to think about it: high-impact releases are scheduled opportunities. They are the moments when large participants act, and when price is most likely to run toward liquidity and commit to a direction.
Start each week by checking the calendar and sorting the days:
-
News days are your likely trading days. Plan around the release time.
-
Quiet days are usually observation days. Trade them only if an exceptionally clean setup forms.
-
A quiet Monday and Tuesday often means the week's real move comes later. Watch Wednesday through Friday, especially once price has built up obvious highs or lows to run.
This alone changes how you trade. You stop forcing setups on empty days, and you arrive at the important sessions prepared rather than reactive.
The same logic applies to the calendar year. December and early January bring thin holiday volume and less reliable price action. Many experienced traders cut size sharply or stop trading altogether during this window.
The framework: liquidity, time and confirmation
Liquidity pools and fair value gaps: where price wants to go
Price is drawn toward liquidity, meaning areas where resting orders are concentrated. There are two things to mark on every chart:
-
Liquidity pools sit beyond obvious swing highs and lows, where stop-loss orders accumulate. Equal highs or equal lows are especially attractive targets.
-
Fair value gaps sit inside a range. These are three-candle imbalances where price moved so quickly that it left an inefficiency behind, and price tends to return to fill them.
A useful working assumption: price typically sweeps a liquidity pool, then reverses toward an open fair value gap. A run above an old high that quickly fails is often the start of a move down into the gaps below.
Quarterly Theory: when the trend turns
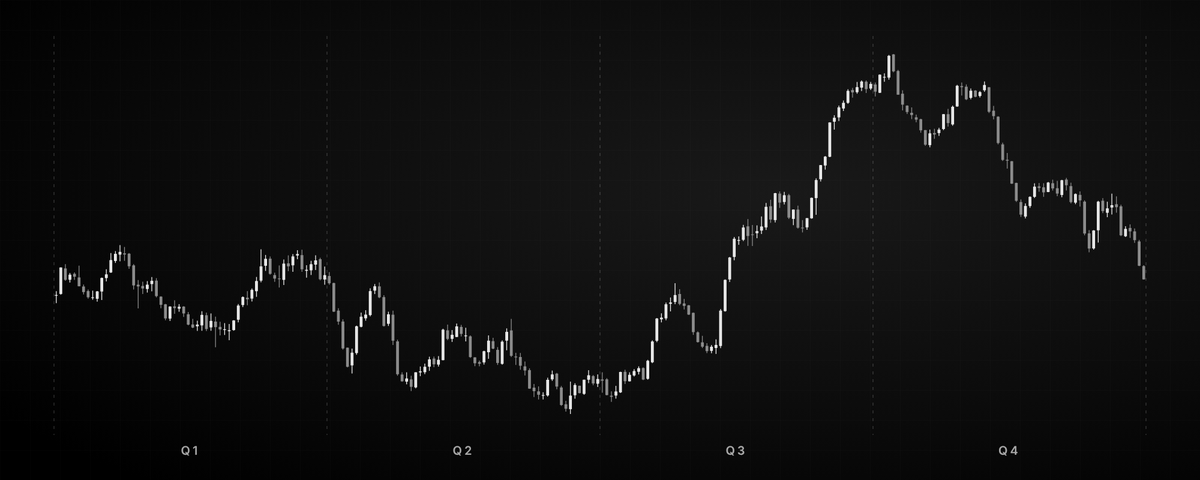
Quarterly theory holds that time moves in quarters, and that different sequences of our beloved four part cycles repeat at every scale. The year divides into four calendar quarters, the month into four weeks, the week into trading days, the day into four sessions (Asia, London, New York AM and New York PM), and each session into four smaller quarters.
The second quarter of each cycle sets the true open, a reference price for the period. Above the true open, price is at a premium; below it, at a discount.
A quarterly shift is the change in direction that happens as one quarter hands off to the next. On the yearly cycle, that means watching the boundaries between calendar quarters, at the turn of January, April, July and October. Because the cycles are nested, a shift on the higher timeframe is usually confirmed by the same pattern playing out in the monthly, weekly and daily quarters inside it.
To apply it:
-
Mark the quarter boundaries on your chart, starting with the calendar quarters on the daily chart.
-
Note the true open of the current cycle, and whether price is trading above or below it.
-
Watch the start of each quarter. A sharp early run on one side's liquidity is often a false move, not the real one.
-
As a quarter ends, stop chasing the current trend. Look for a run on nearby liquidity followed by a sharp break of structure in the new direction.
-
Confirm on the next timeframe down: the same shift should show up in the smaller quarters inside the higher cycle.
Timed moves often look impossible to justify from price alone. A decline can run for most of a quarter, then reverse at the boundary with little warning on the chart. The clue was the calendar, not the candles.
Use the daily timeframe for this work. It governs the macro trend and reflects the positioning of institutions that do not trade off one-minute charts. Lower timeframes are for entries, not bias.
SMT divergence: confirmation at the turn
Correlated markets usually move together. When they disagree at a key high or low, it is a warning. This is SMT (smart money technique) divergence.
Comparing two markets works, but comparing three is more reliable. Group the markets you follow into three triads of closely related instruments.
The first is the equity index triad: ES (S&P 500), NQ (Nasdaq 100) and YM (Dow), which normally move together. The second is the crypto triad of Bitcoin, Ether and XRP, which also move together and tend to follow stocks. The third is the dollar triad of DXY, EUR/USD and GBP/USD. Here the relationship is inverse: when the dollar index rises, the two pairs usually fall, and the other way around.
Within each triad, look for one market that fails to confirm the others. If ES and YM make higher highs but NQ does not, one leg is being pushed into a liquidity pool rather than trending, and a reversal is likely. Near the end of a quarterly cycle, this kind of split is strong evidence the turn is underway.
For the dollar triad, account for the inverse relationship. A new high in DXY should come with new lows in EUR/USD and GBP/USD. If DXY makes a higher high while GBP/USD holds above its prior low, that is a divergence.
Not every divergence is meaningful. Timing and context decide which ones to trust.
Entries: refine, don't chase
Once time, liquidity and divergence align, entries are refined on lower timeframes. Wait for price to sweep a nearby liquidity pool, then retrace into a fair value gap, and enter in the direction of the higher-timeframe bias. When the timing is right, these retracements are often shallow. Sometimes there is only one clean entry, and that is enough.
A note for crypto traders
Bitcoin, Ether and XRP have traded as risk assets for years, and they tend to follow US equities. When they don't, the gap is often temporary. If stocks are falling while crypto rallies, treat the rally with suspicion. It is frequently a run on stops above recent highs before crypto catches down to equities.
Use two checks. First, compare the crypto triad against itself for SMT divergence. Second, keep an ES or NQ chart open beside it, and let the stock market inform your bias.
Keep your charts clean
This approach needs no indicators. Moving averages, oscillators and bands mostly restate price with a delay, and stacking them invites second guessing. Mark your charts by hand instead. Favorite these TradingView drawing tools so they are one click away:
-
Horizontal line, for old highs, lows and key levels
-
Rectangle, for fair value gaps
-
Vertical line, for marking time: session opens, news releases, cycle counts
-
Trend line
-
Fibonacci retracement, configured with extension levels below 0 for projecting targets
A clean chart forces you to understand what price is doing rather than waiting for a crossover to tell you.
Putting it together: a weekly routine
-
Sunday: check the Forex Factory calendar and mark the week's high-impact USD releases.
-
Daily chart: mark the quarter boundaries and true opens, and note whether price is above or below the true open.
-
Mark liquidity: old highs and lows, equal highs and lows, and open fair value gaps.
-
Compare correlated markets: look for SMT divergence within each triad: ES, NQ and YM; BTC, ETH and XRP; DXY, EUR/USD and GBP/USD.
-
Form a bias, then wait for a news day to deliver the move.
-
Enter on a retracement into a fair value gap, in the direction of your bias, with a defined stop.
-
Review your marked charts at the end of the week against what price actually did.
Final thoughts
Fair value gaps and liquidity pools are useful, but neither tells you which setup to trust. Time does. Once you know where you are in the cycle and which days carry scheduled risk, the right gap and the right liquidity pool become far easier to pick out, and the wrong ones easier to ignore.
Start simple: two tools, a clean chart, and an economic calendar. Mark up the daily chart every week, write down what you expect, and check it against what happens. Within a few months you will see the rhythm for yourself, and that is worth more than any indicator.
This article is for educational purposes only and is not financial advice. Trading futures, forex and cryptocurrencies involves substantial risk of loss and is not suitable for every investor. Past market behavior does not guarantee future results.