When to Press, When to Sit
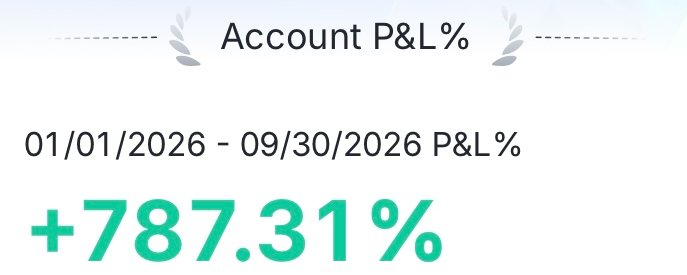
文章目录
Ever wonder why some months feel stupidly easy, and other months the exact same setups just stop working?
I’ve spent the last almost 6+ years learning the expensive way that the difference almost always comes down to whether the environment is actually paying for the type of trades that fit my edge.
In this post, I’m going to walk through the things I personally look at — *the indexes versus their moving averages, breadth, leadership behavior, group and theme participation, setups, and my own Equity Curve *— so I can figure out if we’re in a green, yellow, or red light tape, and then how I use all of that to decide when to press and when to sit on my hands.
These are just the layers I use based on my own feedback loop and experience. Everyone’s process is different, so this is only MY truth, not some universal rulebook to live by.
Anyway, you’ll probably want to SAVE this one for later. :)
Most of what I do now comes down to a simple feedback loop from my own positions & Equity Curve.
I put a little risk on, and the market tells me almost immediately whether my setup is actually present or not. When the first few trades start working, giving me cushion, and other leaders are confirming the same thing, I know I can start pressing. When those trades keep failing, stops get hit, and nothing is holding prior gains, I don’t need a headline or some custom indicator to tell me it’s time to lay low. My own P&L already did.
That’s the part most people skip. They want the checklist and the exact rules, but the rules only matter once you understand when the market is actually rewarding them.
For ex...
-
O’Neil hammered leadership.
-
Minervini talks about progressive exposure.
-
Oliver Kell taught me how to view the cycle of price action.
-
Qullamaggie says the moving averages work like magic in a trending market, but the second you think you’re smarter than them you’re doomed for mediocrity.
I borrowed pieces from all of them, and none of it works if I’m ignoring what the tape is telling me through my own trades.
My Trading Style.
Simple is the new complex.
I’m an aggressive momentum swing trader, and most of what I do revolves around tension and release. When a stock tightens up into a tight range with low volume, it’s building energy, and I’m looking to get in for the expansion that usually follows. I mainly focus on weekly breakouts, Stage 2 transitions, pullbacks into rising EMAs, and high tight flags in liquid leaders. I’m not trying to catch every little move in the market... I just want the ones where structure is healthy, risk is tight, and I know exactly where I’m wrong.
Environment is S-tier for me. Before I get too excited about a chart, I want to know if the market is actually rewarding the type of trades I like. I watch the indexes relative to their 9 and 21 EMAs, how the leaders are acting, whether the groups are participating, and most importantly, whether my own trades are working. If the first few positions start giving me cushion and the leaders are confirming, I’ll start adding. If they keep failing, I size down or just sit on my hands. I usually risk 1% per trade, but that number shrinks when I’m in a drawdown or the tape is weak, and I get more aggressive when things are working and the market is cooperating.
My stops are tight, and my win rate is low on purpose.
I’m not trying to be right all the time, but I am trying to keep the losers small and let the winners run. The only losses I’m okay with are the ones that stay small. I stick to faster-moving stocks (>4% ADR) in hot groups and themes because I need volatility to get a clear read on whether the setup is working. Slow, grinding names just don’t fit how I trade.
At the end of the day, a lot of it comes down to a feedback loop.
I put a little risk on and the market tells me pretty quickly if my edge is there. When it is, I press. When it isn’t, I lay low. Survival and protecting capital come first, and I'm a firm believer in keeping it stupid simple!!
Environment first.
Everything starts here for me. Before I even think about an individual stock, I want to know what kind of tape we’re actually in by looking at leadership, my own setups, and the indices because a great stock in a bad environment becomes a mediocre trade at best. The market doesn’t owe my system an opportunity every single day, and learning that the hard way over the last 6 years has probably saved me more money than I can imagine.
The simplest filter I use is the 9 and 21 EMAs on the indexes:
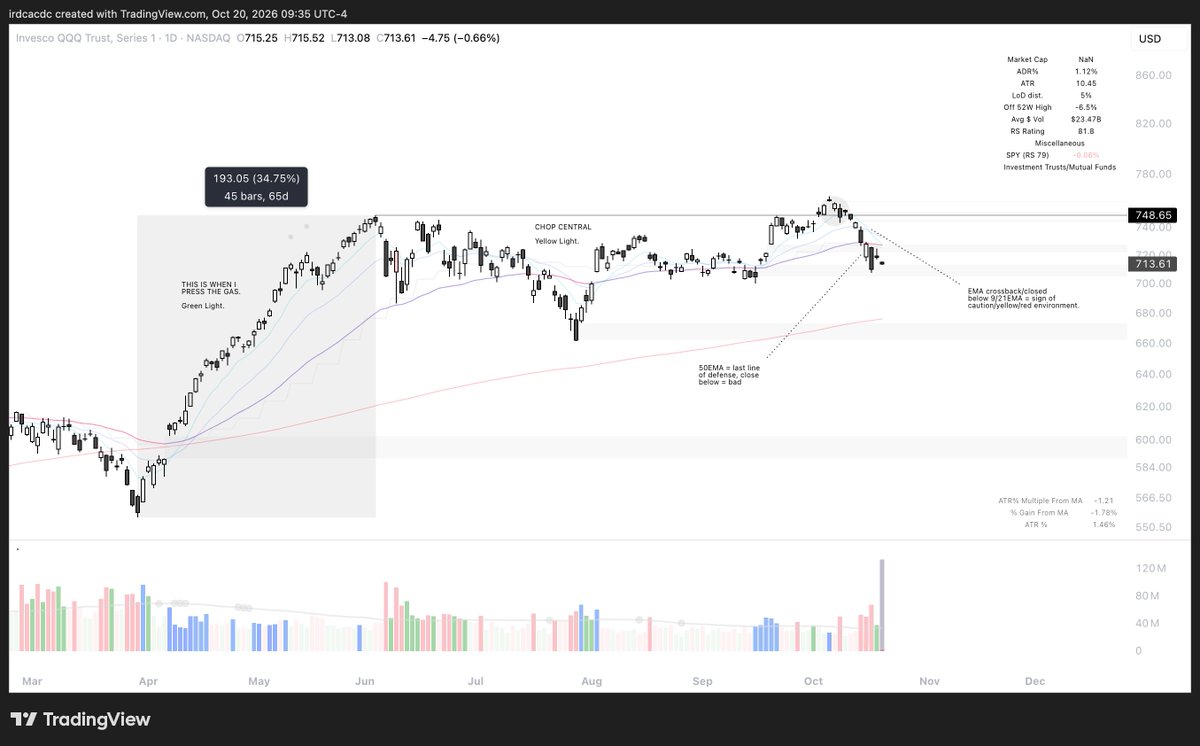
When $SPY and $QQQ are both holding above rising 9 and 21 EMAs, and price is respecting them on pullbacks, the environment is usually much more favorable for the type of trades I like. Breakouts have a better chance of following through, leaders tend to get bought on dips, and the feedback loop from my own positions turns positive more often.
When the indexes are below declining 9 and 21 EMAs, or price is just bouncing into them and failing, I treat it as a yellow or red light.
In those conditions I’m much more selective, size down, or sit on my hands until the structure improves. It’s not perfect, but it’s the quickest way I’ve found to stay honest about whether the market is actually supporting momentum or fighting it.
Leadership/setups:)
I also watch how leadership is behaving and whether my own setups are actually working. If the strongest names are holding up, getting bid aggressively off key levels, and showing relative strength while my pilot positions are giving me cushion, that reinforces the idea that the environment is supportive.
If leaders are breaking down and my trades keep failing right out of the gate, that’s usually enough for me to size down or step aside even if the indexes still look "decent" on the surface.
If you're feeling overwhelmed already, I'd encourage you to focus just soley focus on your own setup playbook + Equity Curve.
Breadth.
Breadth is something I check frequently (majority during corrections), because it tells me how many stocks are actually participating in the intermediate-term trend v. how many are lagging or getting sold. Broad participation makes me more willing to lean into quality setups, while thin participation makes me more selective and patient.
When most stocks are working, the environment feels easier and the same setups start working. When most are not, even clean setups fail more often. It doesn’t guarantee anything, but it keeps me honest about how much of the market is actually along for the ride instead of just a handful of names masking weakness.
I keep an eye on MMTW (percent of NYSE stocks above their 20-day), MMFI (above their 50-day), and MMTH (above their 200-day). MMFI is the one I come back to most because it cuts through a lot of the noise. It’s simply the %% of NYSE stocks trading above their own 50day moving average, which shows me how many names are actually participating in the intermediate-term trend versus how many are lagging or getting sold. I use it as context, not necessarily a hard signal. When I’m deciding how aggressively to press exposure or whether the market feels ready for more setups, I glance at where it sits.
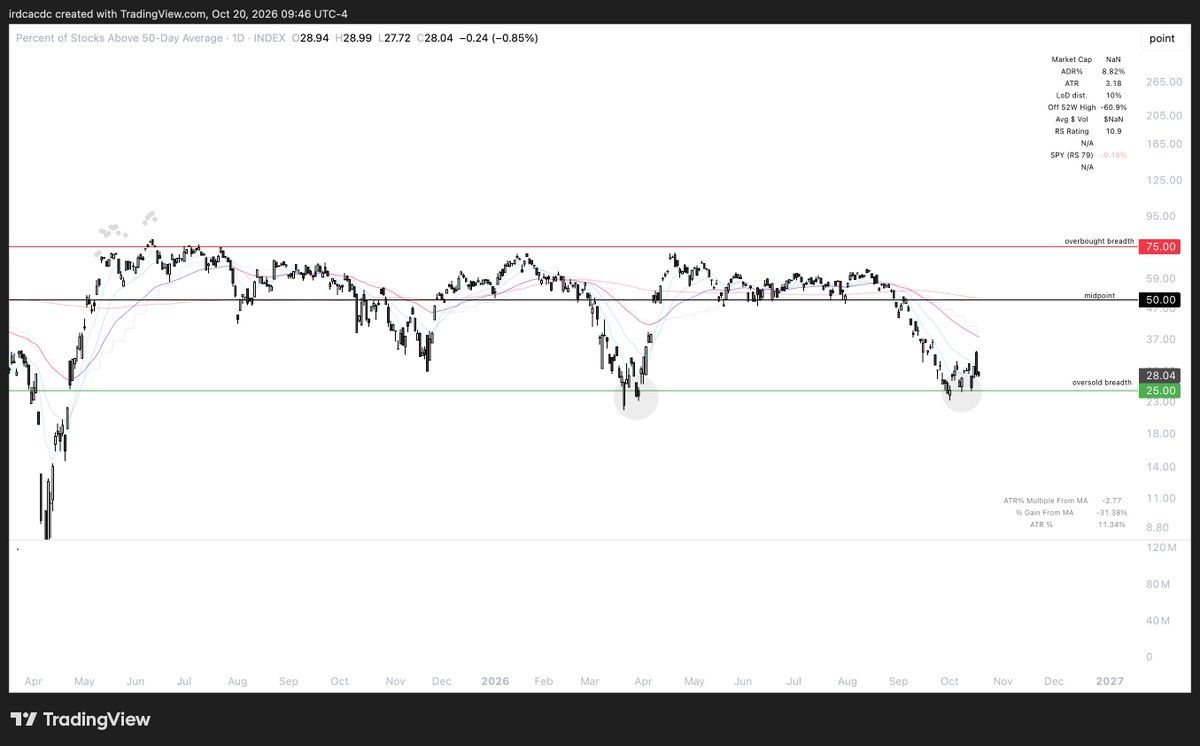
Here are the rough zones I look at:
Above ~70-80%: Broad strength... Most stocks are above their 50day. Things are healthy, but it can also mean the rubber band is stretched. Momentum can stay strong for a while up here, but the easy money in the broader market has often already been made.
Around 50%: Neutral and mixed... Roughly half the market is participating. Not particularly helpful on its own, so I pay more attention to leaders and relative strength here.
Below ~20-30%: Weak and oversold... Most stocks are below their 50day. The market is under pressure. These readings often show up near washouts or when the intermediate trend has rolled over. They don’t guarantee a bottom, but they do tell me participation is thin and conditions are tougher for aggressive long setups.
Ex. I used in the posted I've attached below: "Think of it like a crowded elevator. When MMFI is high (70-80%+), a lot of people are already on the ride and it’s getting full. When it drops under 20-30%, most people have gotten off and the elevator is empty. Empty doesn’t mean it has to go up immediately, but it does mean the pressure has been released."
Strong breadth makes me more willing to lean into quality setups, while weak breadth makes me more selective and patient.
Simple as that.
Breadth: https://x.com/ohiain/status/2112520031716135034?s=20
Indexes vs moving averages.
I watch whether the indexes are above or below their moving averages, specifically looking at whether $SPY and $QQQ are holding above the 9 and 21 EMAs on the daily or bouncing into declining ones, and how the weekly structure looks around the 9week EMA and the 50day areas.
Declining moving averages that price is bouncing into feel completely different from rising ones that price is respecting.
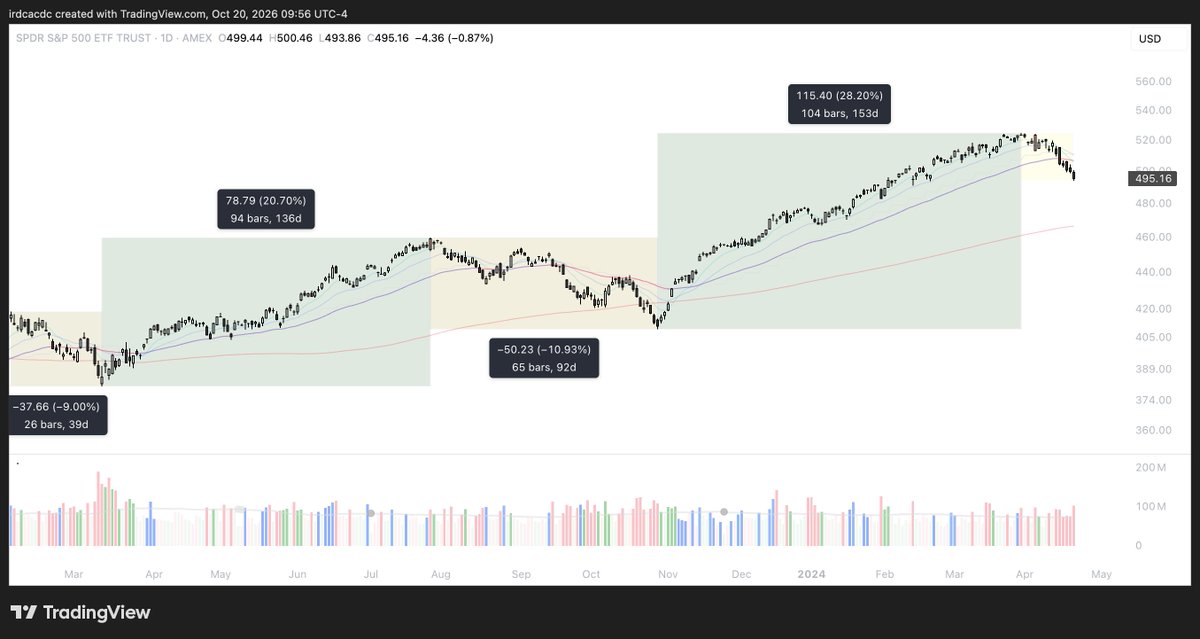
Qullamaggie put it simply when he said that when you’re in a trending market and you get these leading stocks, the moving averages work like magic lines. When they’re not, I’m not trying to force the issue, because I’ve learned that thinking I can outsmart those levels usually just leads to mediocrity.
Simple & effective.
Leadership behavior.
This is non-negotiable for me.
I want to see genuine leaders holding up, getting bid aggressively off big boy areas like the 9week EMA, reclaiming their 50 EMAs, and showing persistent relative strength while the indexes or their groups are softer. If leaders are breaking major weekly pivots, losing their moving averages, and not building constructive multi-week bases, I’m not interested in getting aggressive. A bounce is just a bounce until price proves there’s enough leadership to support something more meaningful.
The way I actually systemize it is pretty simple. Real leadership shows up in how a stock behaves under pressure. The strongest names hold above rising EMAs, make higher highs and higher lows, refuse to break down when the market or their group is chopping, and show clear relative strength versus their peers. They get bought aggressively on pullbacks instead of drifting lower.
Weak names do the opposite. They lose their moving averages, fail to reclaim key levels, lag their group, and break down while stronger names in the same theme are still holding up. Remember cheap is bad!! I’m trying to buy what’s already in demand by institutions, which usually means buying high and selling higher once the structure confirms.
O’Neil was right all along... Leadership and demand come first, and the shape of the pattern is only part of the equation.
Qullamaggie also nailed it when he said that when the market is weak, that’s when you see relative strength, and those are the stocks that hold up while everything else is getting sold. **Those are the potential winners once the market stops selling off.
**I just watch which names separate themselves from the pack and let that tell me where the real demand is sitting.
Group and theme participation.
$$ doesn’t move randomly within the market.
It rotates into narratives and groups that institutions believe have longer-term potential, so I want broader participation across leading groups instead of just one or two names masking weakness everywhere else. If a stock is working against its sector, I need a very compelling reason to care, and most of the time I don’t. I’m constantly asking where capital is flowing right now, not where it flowed last quarter, because fighting the group usually just leads to unnecessary frustration and stops.
1 of the simplest ways I track this is by flipping through a handful of prior liquid leaders in the main themes. Within a couple of seconds I can usually get a pretty good read on whether the group is healthy or not just by watching how those names behave around their 9, 21, and 50 EMAs, whether they hold pivots, and how they respond to selling. If the strongest names in a group are holding up and getting bought on dips while the rest of the market is weak, that’s usually a sign institutional demand is still there. If even the prior leaders in the group are breaking down and failing to reclaim key levels, I don’t need to dig through every name in the sector to know the theme is under pressure.
It’s like fishing. You can have the best setup in the world, but if you’re casting in a pond where nothing is biting, you’re just wasting time.
I’d rather find the ponds where the fish are actually active and then focus on the strongest ones swimming there. When multiple groups are participating and their leaders are setting up, the environment feels much easier. When participation is narrow and most groups are broken, even leading names become a lot harder to trade.
That’s why I treat group strength as one of the higher-priority filters before I ever get excited about an individual name.
How setups are acting.
Questions I ask myself:
- *Are breakouts following through, and are multi/day and multi/week bases forming on the right side with EMAs curling higher?
- *Or are stocks bouncing into declining moving averages and getting sold again?
In stronger environments, the same pattern that fails in a weak tape starts working...in weaker ones, even textbook setups stop out. Context is of utmost importance, and if the number of trades that actually fit my system is shrinking while the remaining ones look sloppy, that’s something I take note of. I’ve been burned enough times forcing mediocre ideas that I know what that feels like. Paytience will pay.
Most of my process revolves around one simple idea: tension and release.
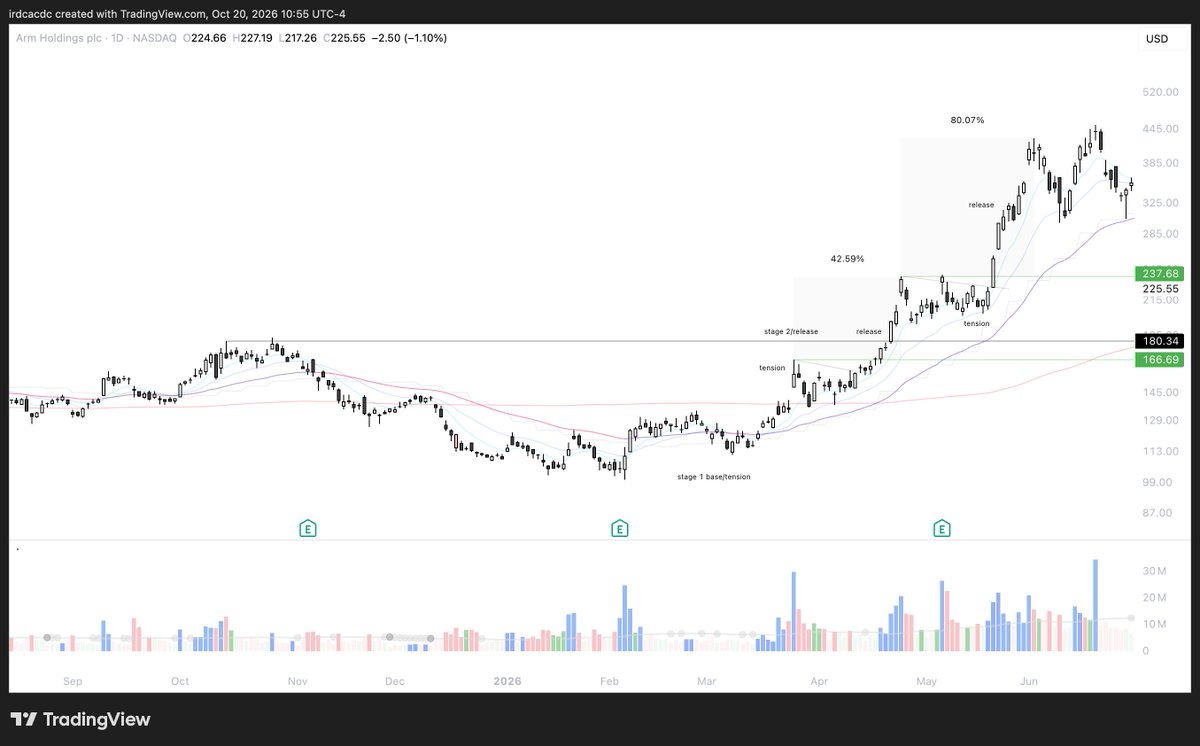
When a stock compresses into a tight range with declining volume, it’s building energy. Supply gets absorbed, volatility contracts, and eventually that tension between buyers and sellers results in expansion. That’s the move I’m trying to position for. Think of it like a coil...the tighter it gets, the more energy is stored, and the bigger the potential release when it finally expands. Loose, sloppy price action doesn’t store that energy the same way.
That’s why I spend more time watching for compression in leading names than I do chasing stocks that are already extended or drifting around with no structure.
I also pay close attention to whether healthy bases are actually forming.
Also after a strong move, the best names don’t collapse. They digest the move by building orderly multi week bases, making higher lows, and respecting rising EMAs.
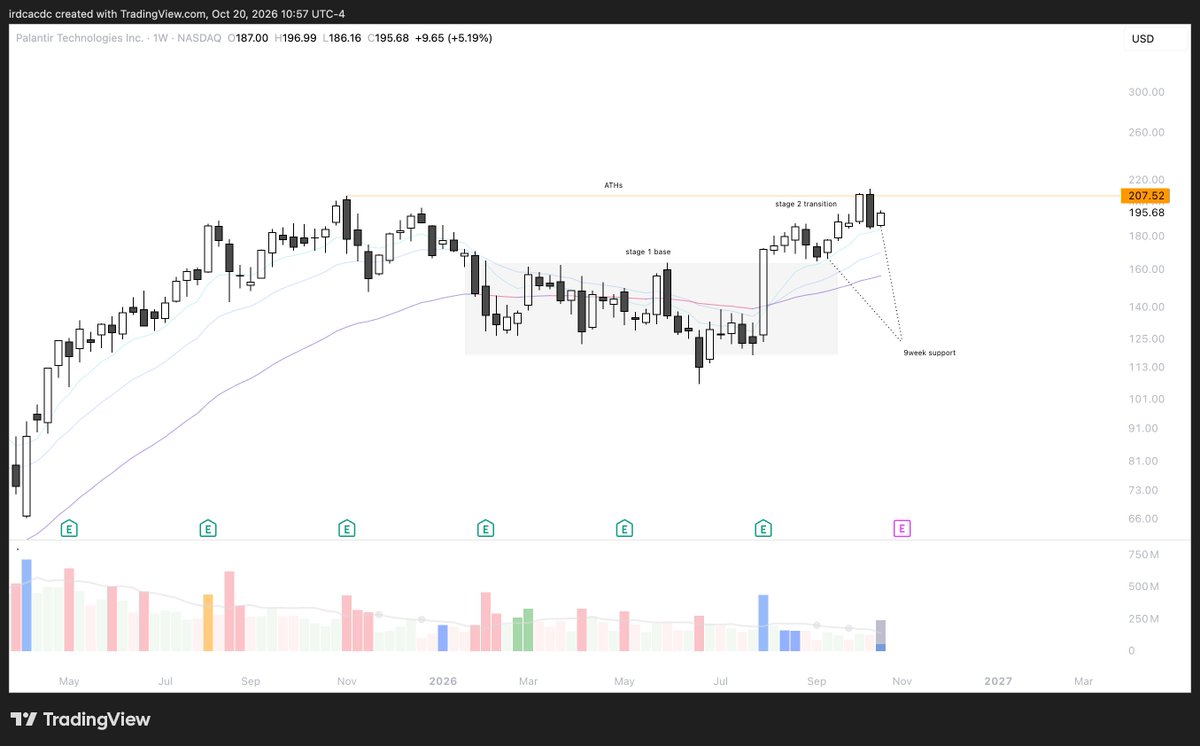
For ex. $PLTR right now I would consider to be a main focus with where the market is currently situated.
When I see leaders pulling into their 9week or 50 EMAs and getting bid aggressively off those areas, with volume drying up and ranges tightening, that tells me the setup is still constructive. If instead stocks are just bouncing into declining moving averages and sellers step back in, or if quality bases are practically nonexistent across my watchlist, I treat that as a warning. 1 green candle after weeks of technical damage doesn’t mean the correction is over if half the names I care about are still below declining MAs and fresh bases are scarce.
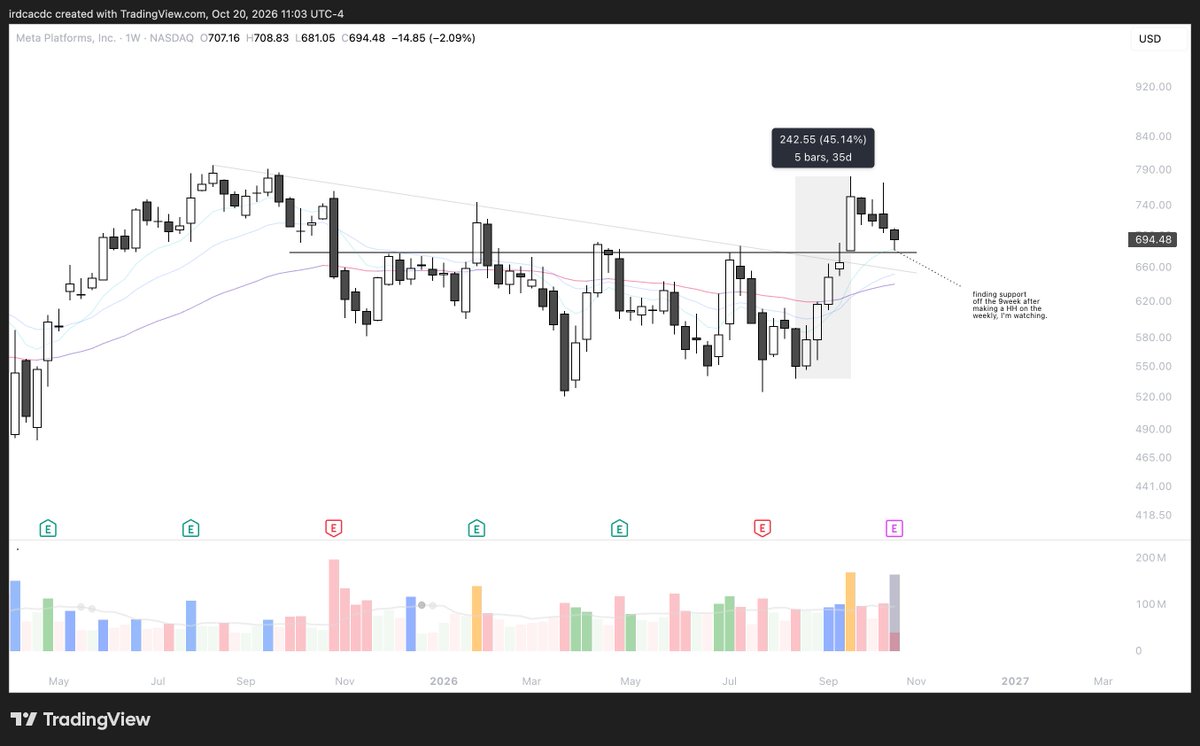
$META is also another ex. of how strong names will continue to find buyers around the 9week support. ** This is also why I don’t need a huge number of setups!! ** Roughly 5% of my trades account for the majority of my results in any given year. I’d rather wait for 1 or 2 fat pitches in liquid leaders building tight bases than take ten mediocre ones just to stay "busy." Forcing B and C setups in a weak environment only reinforces bad habits and slowly bleeds the account. When the number of trades that actually fit my system starts shrinking and the remaining ones look sloppy, that’s usually my cue to sit on my hands.
The market will eventually offer better opportunities. I just have to be patient enough to wait for them.
Green, yellow, and red.
GREEN... looks like broad participation, indexes holding above moving averages, leaders reclaiming or holding rising ones, groups participating, breakouts following through, and constructive bases forming. This is where majority of my WL is in the upper right hand of the chart + my setups become visible and the market starts paying for them, so I’m more willing to press.
YELLOW... is mixed.** **Breadth is somewhere in the middle, leaders are pulling back into areas like the 9week or 50 EMA, and I’m watching how they respond while some groups stay strong and others don’t. I’m content sitting on my hands, trying smaller pilot positions, tracking relative strength, and letting the strongest names separate themselves. Not yet, but I’m paying attention, because I’d rather wait for the evidence to build than force it.
RED... is thin participation, leaders breaking down, declining moving averages, distribution in liquid names, and setups failing. This is where a lot of people get impatient and start forcing trades. I’ve learned the hard way that protecting capital is just as important as making it, so in these environments I reduce size and frequency or step aside.
BTW... anyone can look like a genius when everything is ripping. What you keep when the environment changes is what actually matters.
;))
Your Equity Curve.
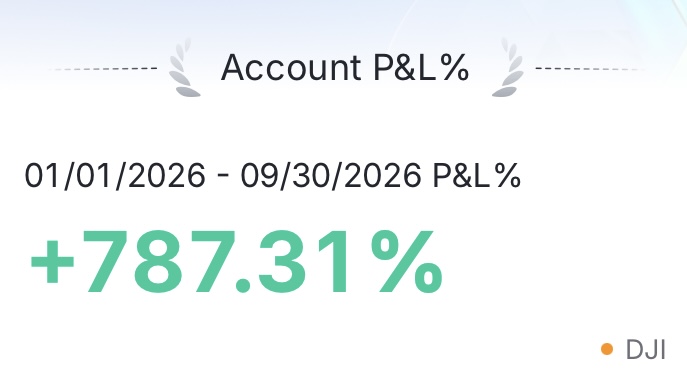
A huge mistake I see people make is getting lost in all the noise. There’s so much data, news, and random opinions flying around that it’s easy to overcomplicate everything.
At the end of the day, every trader has one source of truth that actually matters: their own P&L.
Slap it on a T-Shirt!!
Your equity curve is your feedback loop.
It tells you whether your approach is working in the current environment better than any headline or someone else’s take on the market. For me personally, understanding conditions isn’t about memorizing macro predictions or trying to figure out what the Fed is going to do next. It’s about paying attention to the things that actually give me useful context, then letting that guide how aggressive I am, how I size, and how much capital I’m willing to put to work.
I always start with myself.
-
How are my trades performing right now?
-
Are my winners giving me cushion or am I getting stopped out constantly?
If the indexes look weak but my setups are working and giving me room, I trust that and stay in the trade. If the market looks fine on the surface but I’m in a losing streak and nothing is holding gains, I ignore the outside commentary and get defensive.
My own results guide me more than anyone else’s opinion. That’s the CLEAREST signal I have.
Scanning & Watchlists: Hot Names + Themes.
I wasn't going to add this, but why not... I've already spent hours on this article.
I also look at the actions of individual stocks and my watchlists.
How long are my watchlists?
-
short WL = weaker environment
-
long WL = many opportunities = strong environment
Which names are holding up?
Which sectors or themes are rotating in/out?
Watchlist upgrades and downgrades matter because they show me how healthy the market is right now.
How I actually use this to gauge the market.
*PREFACE: I don’t treat any of this as a hard buy or sell signal. * These are layers of probability that help me decide how much risk I’m willing to put on. Everything revolves around RISK comfortability for my own personality.
When enough of them line up and my first few trades start working and giving me cushion, I know the edge is present and I can progressively add exposure, just like Minervini talks about. The market & my positions have to earn the right for me to press. When the layers don’t line up and my trades keep failing, the feedback loop turns negative and I get defensive. Survival and drawdown control come first, and everything else is noise!!!
And yes, there are periods where it almost feels stupidly easy. Breakouts follow through, pullbacks get bought, and leaders give you immediate cushion. Every time I put a little risk on, the market basically says keep going. Those are the environments where I get aggressive because my setups are visible and working.
Then there are the other periods where the exact same setup that ran hard 2 weeks ago breaks out, goes a couple %, and round-trips by lunch. My stops start getting hit, fewer names are holding gains, and fresh bases are scarce (the current environment). At that point I’m not looking for a reason to force another trade, but rather looking for reasons to sit on my hands, because doing nothing is still a position.
I’d much rather be bored in cash when conditions suck than exhausted and down when the next real opportunity finally shows up.
The beginning to the end.
Anyway, I know this one got a little long. I tend to just keep going once I start writing about this stuff. My apologies in advance, I am human.
A few last thoughts before I wrap it up... you can study every setup/trader out there and still lose money if you can’t sit in cash when the edge isn’t showing up. The market doesn’t hand out opportunities every single day, so a big part of this is learning to tell the difference between when it’s paying for your trades and when it’s not.
-
Trust yourself & believe in the hard work you've already accomplished.
-
Press when your setups are working, and lay low when they’re not.
-
Keep the losers small, protect what you’ve built, and survive long enough to still be here when the next good stretch shows up.
If any of this was useful, you’re more than welcome to stick around. I'd encourage you to do so and engage with my thoughts:) it makes writing fun again!
I’m just a 22y/o who’s been obsessed with this for a while now, paid plenty of tuition along the way, and is still figuring it out day by day while trying to keep things as simple as possible.
I share the process, the good stretches, the ugly drawdowns, and whatever random thoughts come up while I’m sitting at my desk waiting for the next wave. Feel free to follow along if you want!!
We’re all just trying to get better at this without losing our minds or our accounts in the process.
Love you all.
Godspeed!
TGBTG.
- iain 🩵