How to make money in stocks (full guide)
文章目录
Most traders make trading way more complicated than it needs to be.
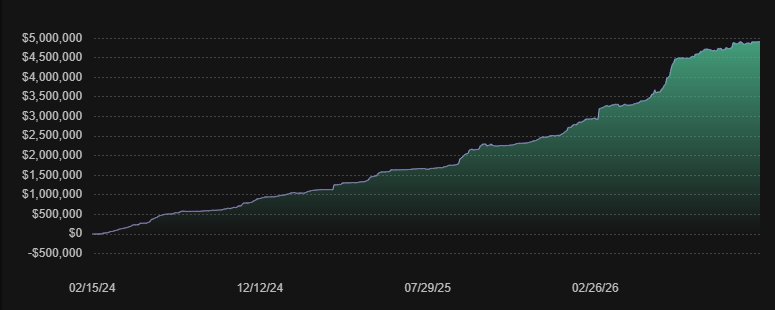
I've made millions trading stocks, and the strategy I use is probably a lot simpler than you think.
But it took me years of losing money and learning garbage before things finally clicked for me.
Find a strong market Find the stocks leading it Wait for them to set up
& actually give your winners time to make you money
It sounds simple... but there's a process behind all of it
You need to know what to buy, when to buy it, where you're wrong, and how to manage the trade once you're in it
That's what I want to walk you through in this article
The entire system that came together when I stopped trying to figure everything out on my own and started studying the best traders in the world
I realized all these traders had 2 things in common...
1. They were not day traders
The richest traders in the world, are not day traders... contrary to popular belief this is actually the worst way to trade stocks
The reason why is because you are not able to take advantage of the biggest moves in the market... those actually happen overnight
This is where swing trading comes into the mix... instead of buying and selling a stock in the same day, you actually hold stocks for days and potentially months..
2. The best traders, trade with momentum (trend)
The best way to make money in the stock market is not to fight the trend and try to guess every tippy top or bottom...
Its actually to just play the trend.. as simple as that sounds.
Buy the best stocks in the market, in the best sectors that are leading the markets higher.
Stocks are expensive for a reason.. only buy the best stocks and leave the garbage behind.
Once I understood these 2 concepts, I started piecing a strategy together that can actually work.
I started building an entire system.
This way I know exactly what to do, when to do it, why, and how.
1. Finding market trends
The easiest way to find out if the markets are trending is to:
Pull up a chart on TradingView
and add the 8, 21, 50 EMA's
EMA's can be used as a momentum gauge for when the markets are the hottest and stocks follow through the most.
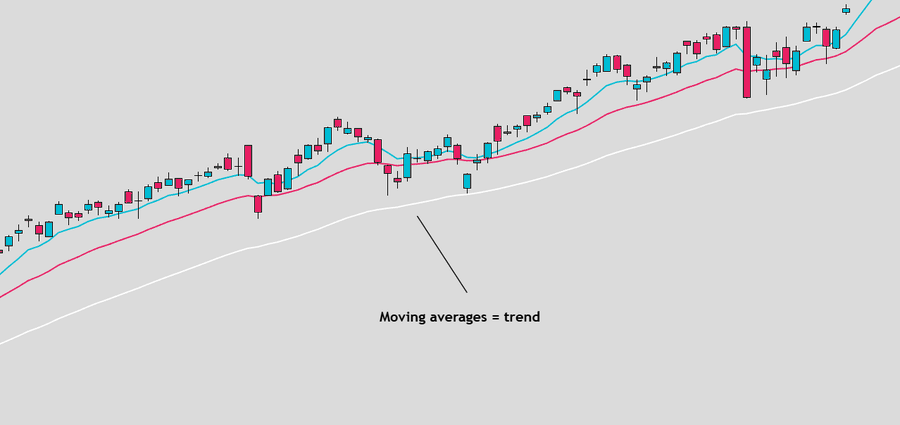
Exponential moving averages
Now that we have the EMA's on the chart, we can make some rules for when we want to be active in the markets.
Use $SPY / $QQQ
Whenever $SPY / $QQQ are above the 8/21/50 EMA's, we want to be long with full size/conviction
We can also use this on the individual names we are swing trading to narrow down our criteria.
Stocks above moving averages = strong trend
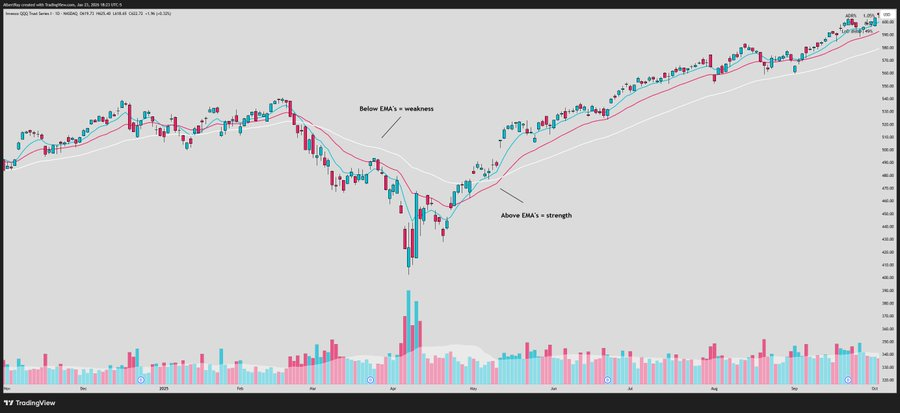
Our goal is to trade the market whenever there is a strong active trend and take advantage of that..
Sometimes the markets will enter periods of chop where there will be no active trend... during these periods, reduce your size and wait out the chop as the probabilities for gains are much lower.
2. Finding the leading stocks
Once you establish that the market is in an uptrend or breaking out of a consolidation zone you want to find the strongest stocks to trade
Remember this strategy is about finding the momentum in the market and not just trading any random ticker you choose..
We need to find the stocks that institutions are pouring money into, the stocks that are leading the markets higher and holding up best when the market pulls back
These are our true market leaders...
To establish a true market leader there's a few things you need to look for:
-
Hot theme
-
Macro tailwinds
-
Volume (Liquid)
-
Relative strength
-
Clean Price Structure
There's a lot of different factors to look for, and this is a skill you will develop over time the more you are involved in the markets
Luckily for you, I built the single greatest momentum scanner there is that pretty much narrows all of the stocks in the market down to a list of all the true market leaders
Easiest way to scan for leading stocks and themes is to use: TradingView
Click on screener(bottom left)
We want to narrow it down to search for liquid stocks that are leading the market higher on volume
Here are the parameters I use in my scan:
-
Price: > $3
-
Market cap: > $300m+
-
Volume: >500k
-
Change: >0.01
-
ADR > 2%
And most importantly, the 8,21,50 EMA's below price to find leading names
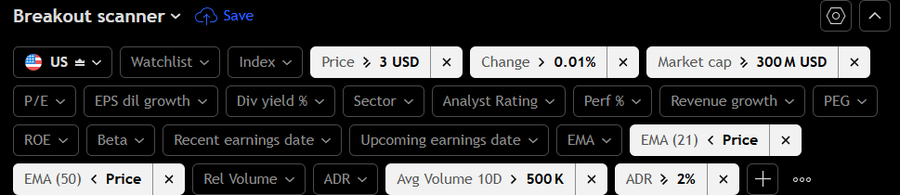
Now we have a list of the strongest and most liquid stocks in the market
What I love about this scan is that you only get about 200-300 stocks so you can narrow it down to the leaders pretty quickly
Sort the list by volume descending, this allows you to see the stocks with the highest volume on the day (most important part)
Now that we know how to scan for the strongest stocks in the market, we need to understand the setup that we are looking for to be able to enter these trades
3. Setup
To understand the setup, you need to understand how stocks move in the markets
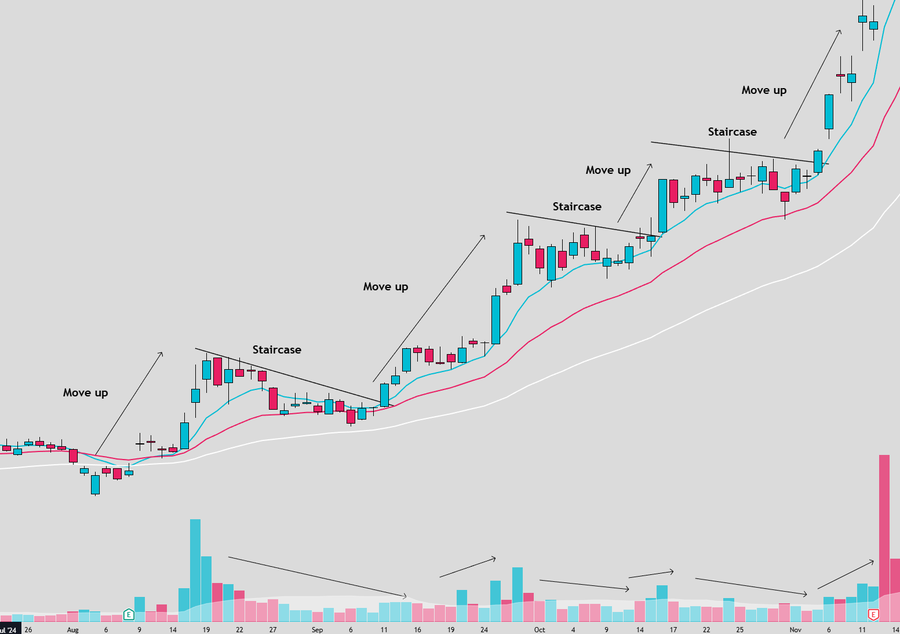
Stocks don't go straight up and they certainly don't go straight down, they move in trends like a staircase...
A stock will:
Make a large move higher → consolidate (rest) → continue to move higher
Stocks will do this as long as a strong trend is intact (this is where the money is made)
If we can find the sweet spot where the stock starts to break out of its consolidation and into the next move higher.. we can get a perfect low risk high reward entry and ride the momentum of the markets higher.
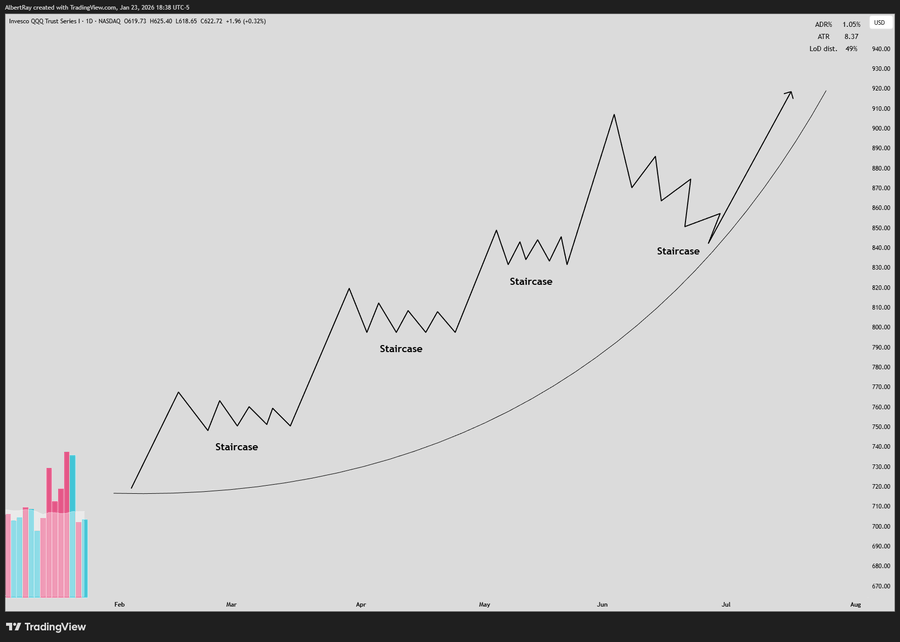
This pattern is called a bull flag or pennant
The important part is not the name of the setup don't focus on that .. just focus on finding tightness in the market (consolidation)
You need to be looking for stocks that are getting very tight, not making any new highs, and not making any new lows.
Because when they start to breakout and make their move.. they are going to explode.
Just like a spring when it gets super coiled up → and you release it = big move.
When looking for this setup, use the 1D or the 1W chart.
The bigger the timeframe the bigger the move that we can get in the market...you don't want to focus on the lower timeframe because setups can develop a million times a day
BUT
Finding a daily setup that is high quality is much much more rare... and weekly is even rarer.
The best setups are the ones that take time to form.
The goal is to find names that are either just breaking out or about to breakout of tight bases
Use this checklist
-
Tight pattern or base
-
decreasing volume on consolidation
-
Setting up above the moving averages
Below are some examples of setups I look for:
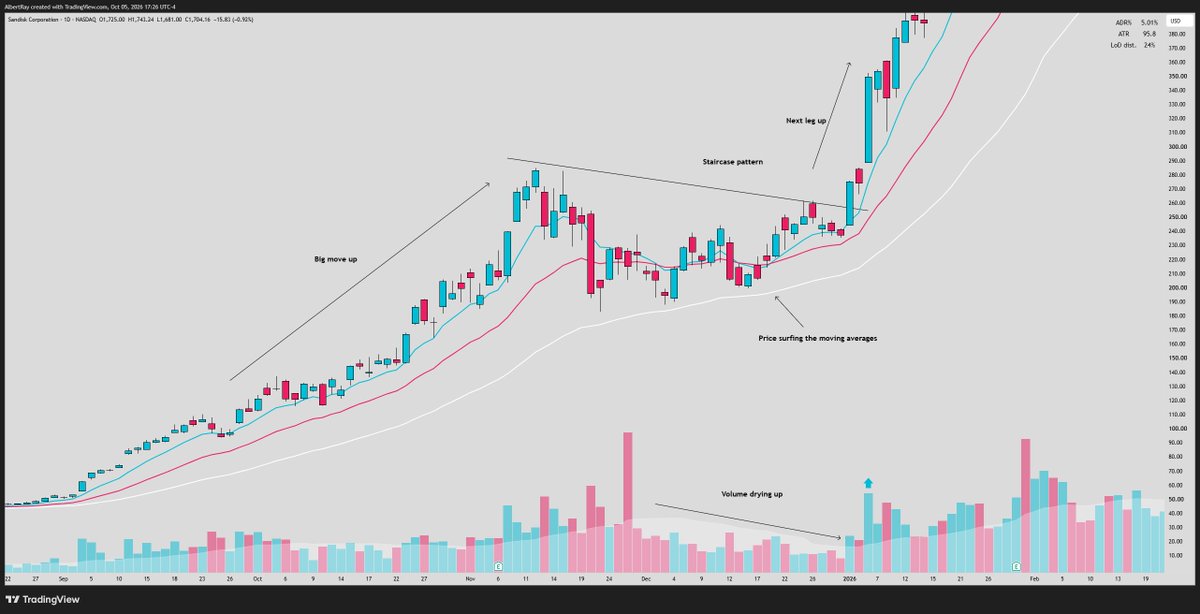
$SNDK 1d
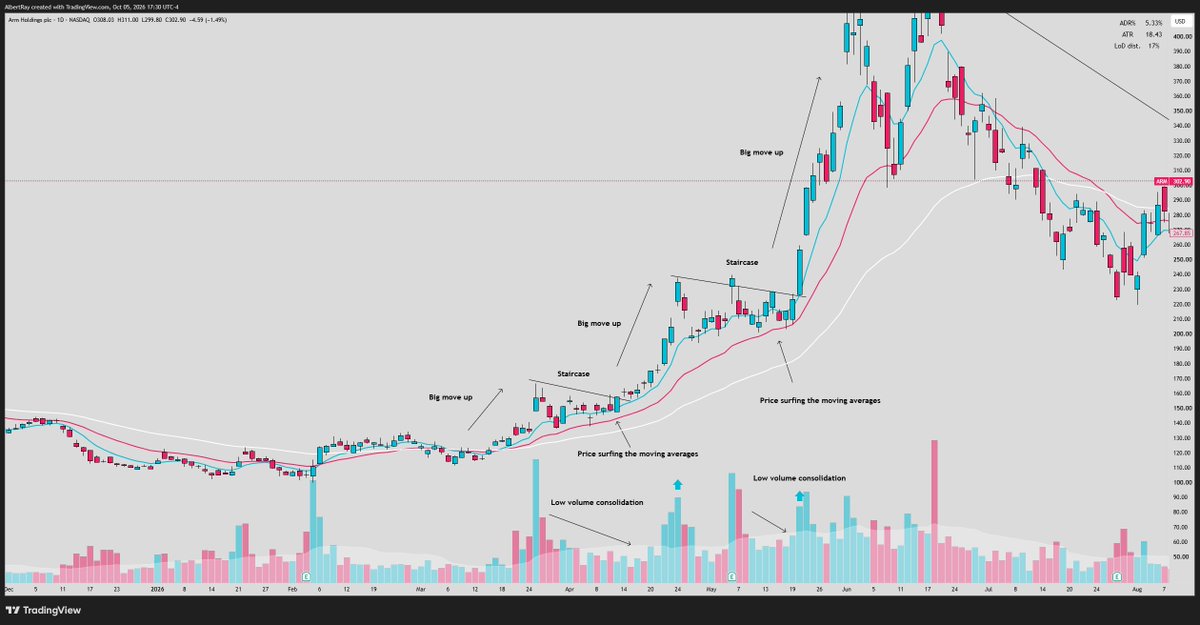
$ARM 1d
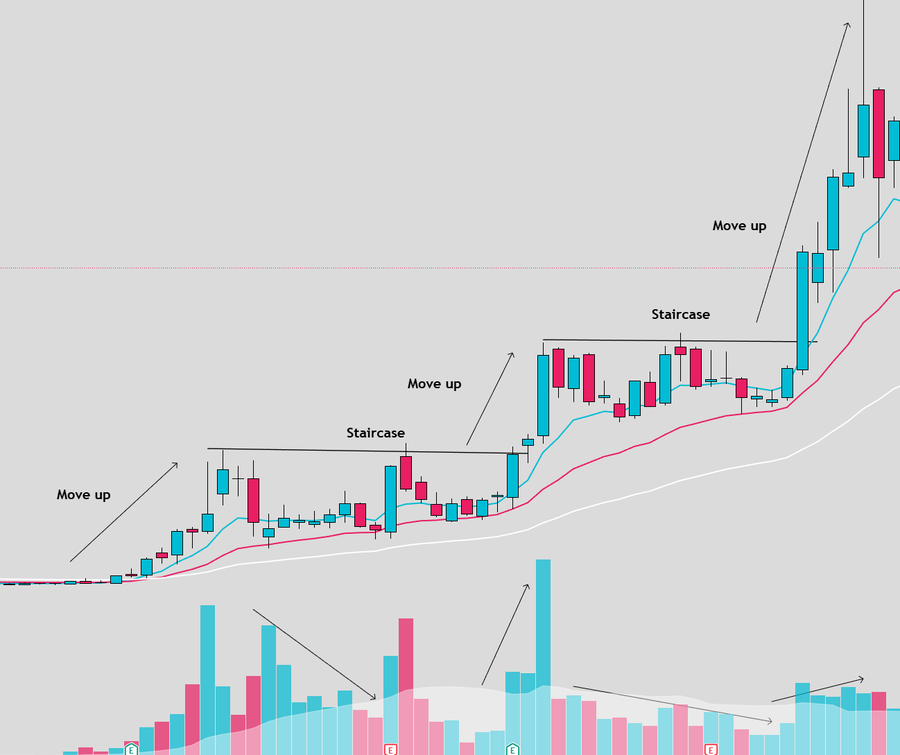
$QBTS 1d
$RKLB 1d
We are not looking to "predict" the next big winner... we want to trade stocks that are already showing momentum and a solidified trend
Because this tells us the stock has a REASON to go up... many people focus on stocks with no reasons to go up
Reasons could be:
-
Theme
-
Narrative & Story
-
Strong earnings
-
Macro tailwinds
Focus on stocks that have a reason to keep going up... the hot stocks
You don't want to be too early BUT you also don't want to be late...
The sweet spot is the first or second staircase that develops in a hot trend
The more times a stock staircases in a trend and the higher it goes the less likely the pattern is to work.
Now we want to use our scanner and new knowledge of setups:
To scan through all these stocks and look for setups that match our criteria, we want to find 4-5 of the best looking stocks and create something called a focus list:
A focus list is a more in depth watchlist consisting of a few of the best looking charts in the market.
By focusing on only a few of the best setups in the markets we can stop ourselves from overtrading and focus on executing our plan.
Take out the guessing game in trading, and trade solely off of preparation.
4. Entry
There are 2 ways to enter a leading stock:
The easiest is what's called a breakout
A breakout happens when a stock "breaks" out of a staircase consolidation pattern
This is a super simple way to trade and why its so effective because you can get the perfect entry on a stock... not when its down trending and struggling not when its chopping and going sideways
BUT
Right when the stock starts to get momentum and is ready to breakout of the range
For breakouts you are looking for 3 things:
-
Tight range consolidation (Staircase)
-
Break above key level (Trigger)
-
Volume confirmation on breakout
Its as simple as that, when all 3 of these happen an entry signal occurs
The most important part is finding a valid trigger for your breakout
What I look for, is a previous level of resistance that price has rejected multiple times
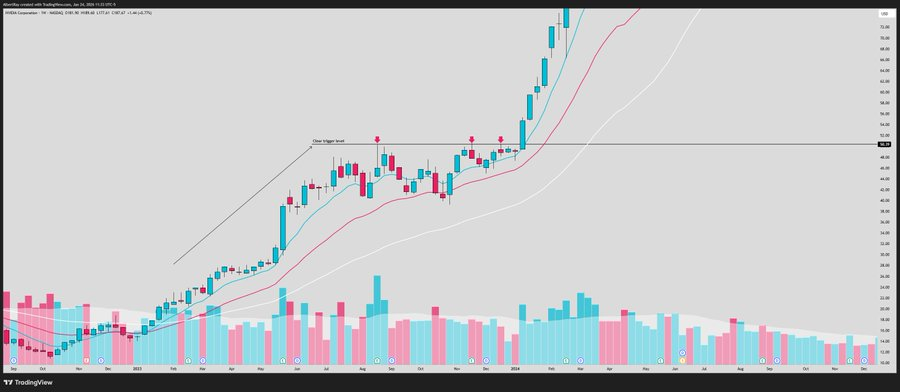
$NVDA 1d resistance
In this example, you can see the $50.4 price level has rejected multiple times
If price breaks over that level, then we can assume a daily breakout is likely to occur
We want to confirm the breakout with lots of volume over the trigger level
I'm looking for price to clear the level and volume to start pouring in... that's what would give us the breakout entry.
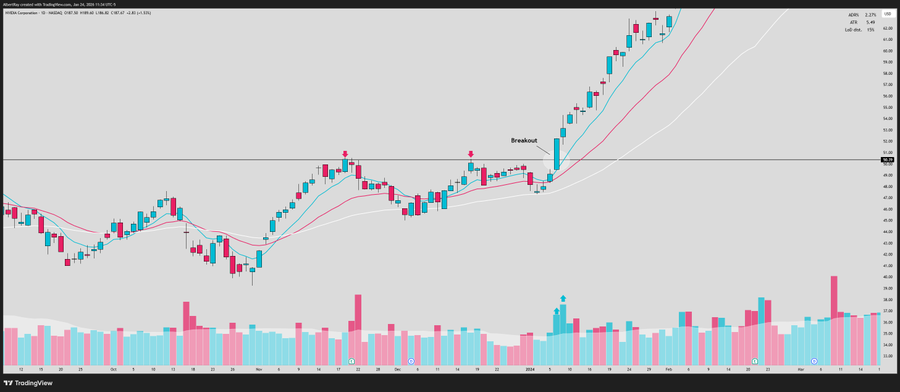
$NVDA 1d breakout
Just like a coiled spring ready to explode...
The longer a stock compresses → the bigger the move that follows.
Once you establish a trigger level on the daily or weekly timeframe, you can now use the lower time frames like the 5 or 15m to get what I like to call a "Sniper entry"
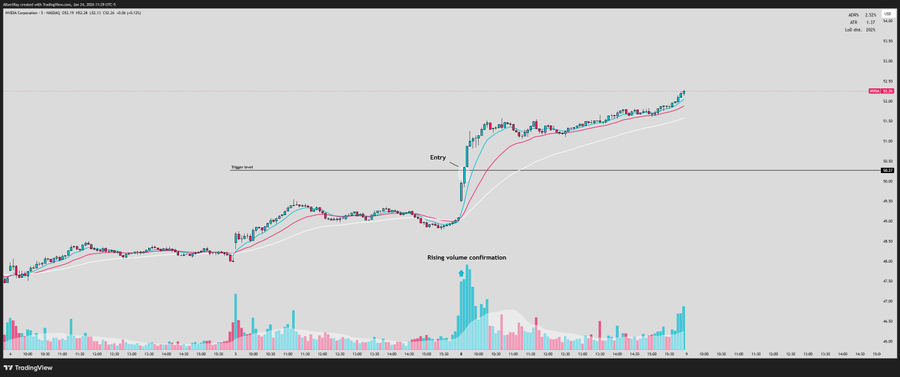
$NVDA 5m
Entry is taken on the break of the trigger level with VOLUME as confirmation
The magic of this strategy is that we are getting a daily and weekly timeframe magnitude move with the risk of 5 and 15m charts...
Let me explain:
Our stop loss is placed at the low of the day when taking the breakout
This gives us a tiny amount of risk, for a massive reward.. and because when stocks breakout they usually don't come back down to revisit the entry you can catch some massive winners over the years
Just like:
$NVDA $SMCI $TSLA $ARM $DELL
that ive caught just in the last 2 years
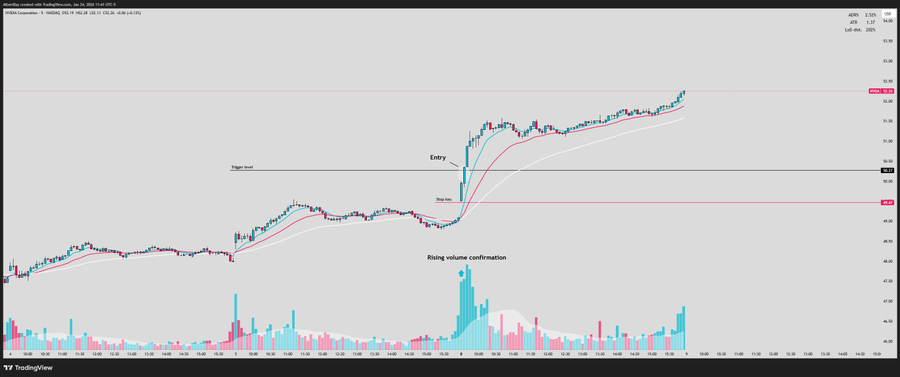
The most important part of the strategy is risk management... never expect every single trade to work.
You will always be wrong in trading which is why managing your risk is very important
A loss, is a papercut
A win is a gold mine
Stop loss is placed at the low of day.
Our second entry criteria is a little bit more tricky
Its called an undercut or undercut and rally
This happens when a stock sets up in a staircase pattern but instead of breaking out higher it breaks down first... but only for a short while before reversing back into range and starting its breakout higher
The pros of the undercut are:
-
Tighter risk
-
Higher win rate
-
Better in choppy markets
The downsides are in strong market, the best stocks will never give you these type of entries... they will just run and run and run and lock you out.
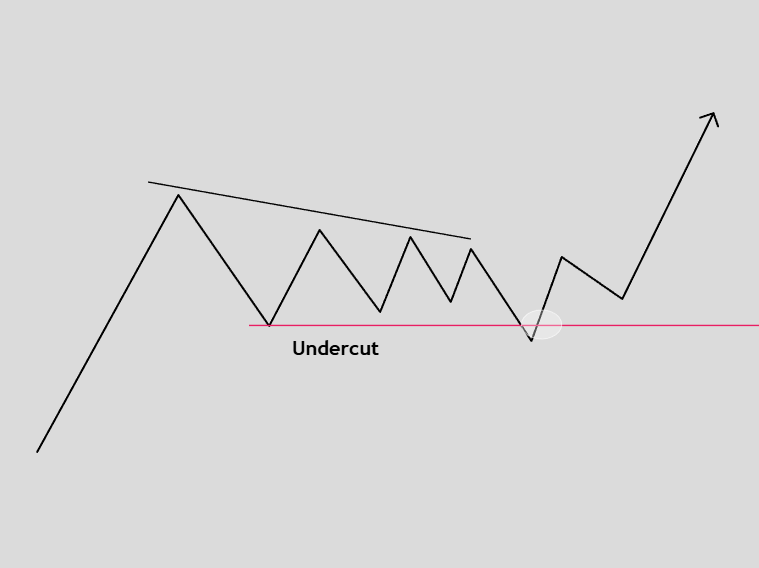
Example of undercut
An undercut will happen quick so you have to be fast
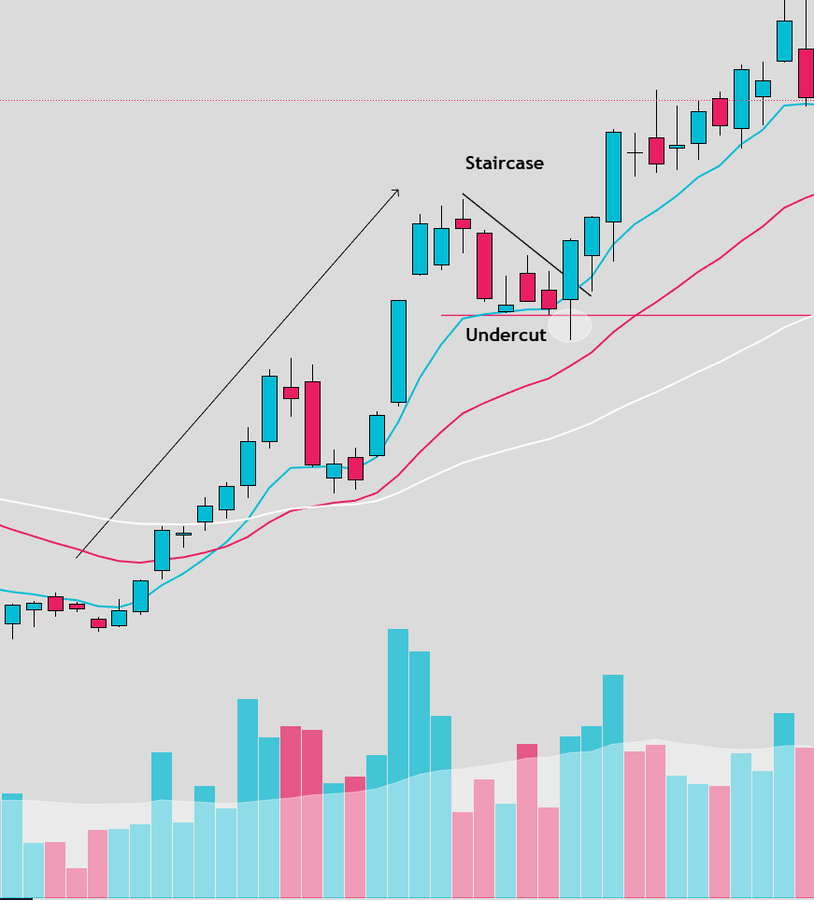
If the stock dips below the low of that base and then reclaims back through the level, that would give us the undercut and rally entry.
The important part is the reclaim... just because it breaks below the low doesn't mean we have an entry yet.
As always you want to mark your level on the daily chart but the magic is done on the lower time frames, I like to use the 5m chart:
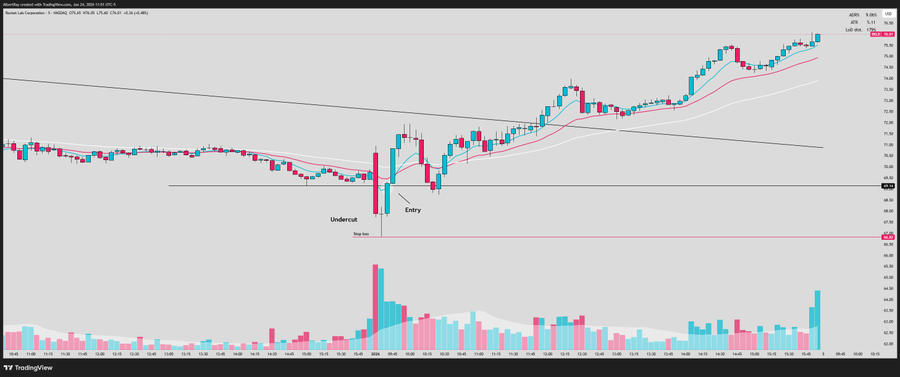
Entry is taken right when the stock reclaims the undercut level and stop is immediately placed at the low of the day
This gives you a low risk high probability entry.
5. Targets and managing the trade
Now comes the most important part of the trade... not selling too early and leaving profits on the table
A lot of new traders have a common misconception that base hits are what keeps you alive in trading... the truth is you have been lied to
The best traders do not just stack "base hits" because mathematically this will not result in outperforming the markets...
To outperform the markets you MUST have big winners, and the only way to guarantee a big winner is to be able to hold your winners.
It sounds easy but its actually one of the hardest parts of trading... what do you do when you are up thousands and maybe even millions of dollars on a trade? Do you just take the profits because they are there? Or do you use a system to tell you when the trade is likely to lose momentum...
That's what I learned from the greats
So this is how we do it:
Instead of selling your position all at once, you're going to start trimming out of your positions...
This means you will sell the position in portions, I like to use 1/4th's
Your first trim:
You want to trim some on a first target.. this should be a big level of resistance
This allows us to take some profits off the table, finance the risk of the trade and move up our stops to protect us from a failed breakout
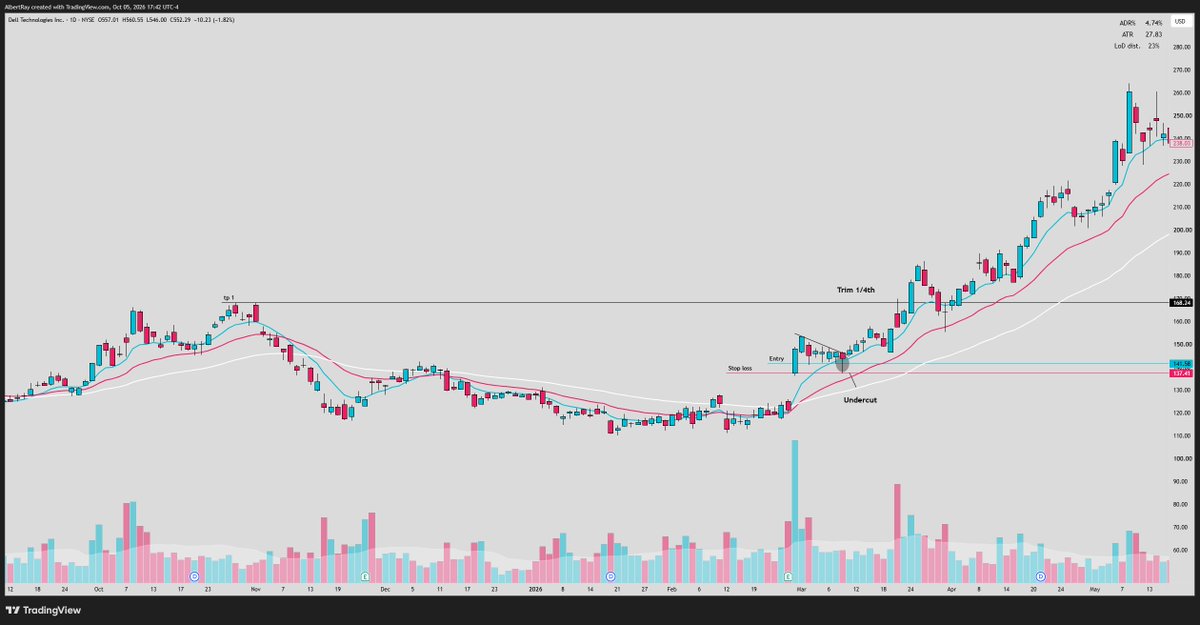
Once you trim into strength, you can now move up your stop loss to breakeven
Once those first target is hit, you are down to 75% of your position and this is where the magic happens.
You will never be able to time the "perfect" moment to sell, this is why we use the moving averages to tell us when the trend is losing steam and the best time to sell is
"No one is smarter than the moving averages" - Kristjan Qullamaggie
Second trim:
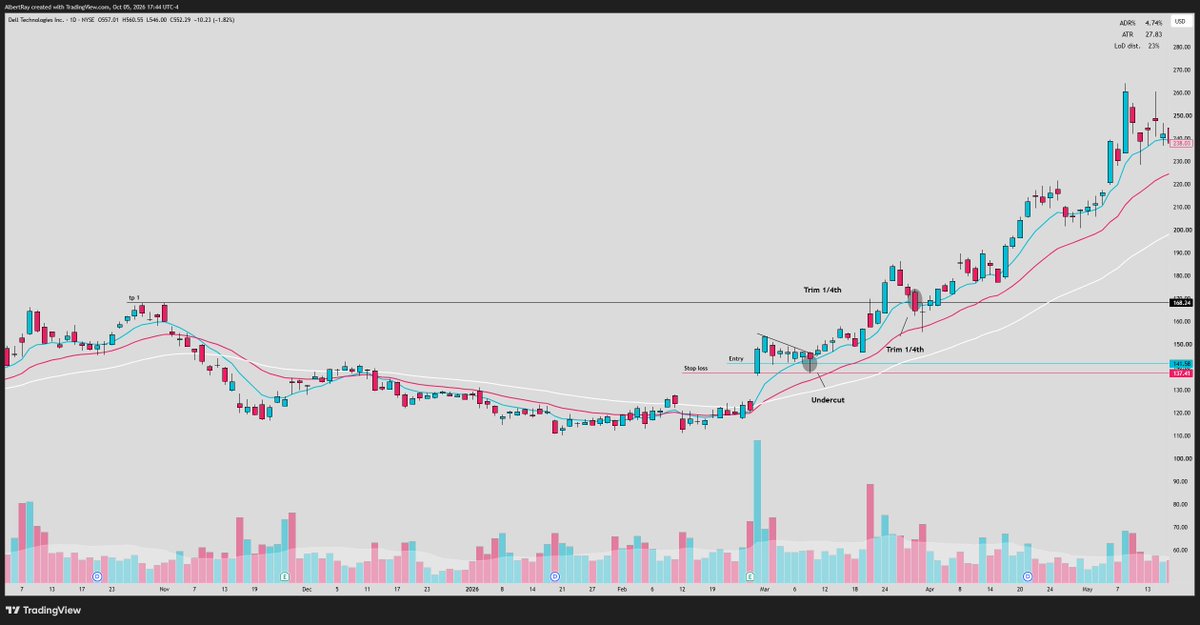
You are now going to trail the 8 EMA for your trim
When the stock closes below the 8 EMA you will take off 25% of the position
This is how we try to protect the gains from a big roundtrip... we're using the stock's momentum to tell us when to take more off.
This is of course not always going to be the case.. sometimes stocks break the 8 EMA and continue higher
Which is why we leave the rest of the position to trail with the 21 EMA
Third trim:
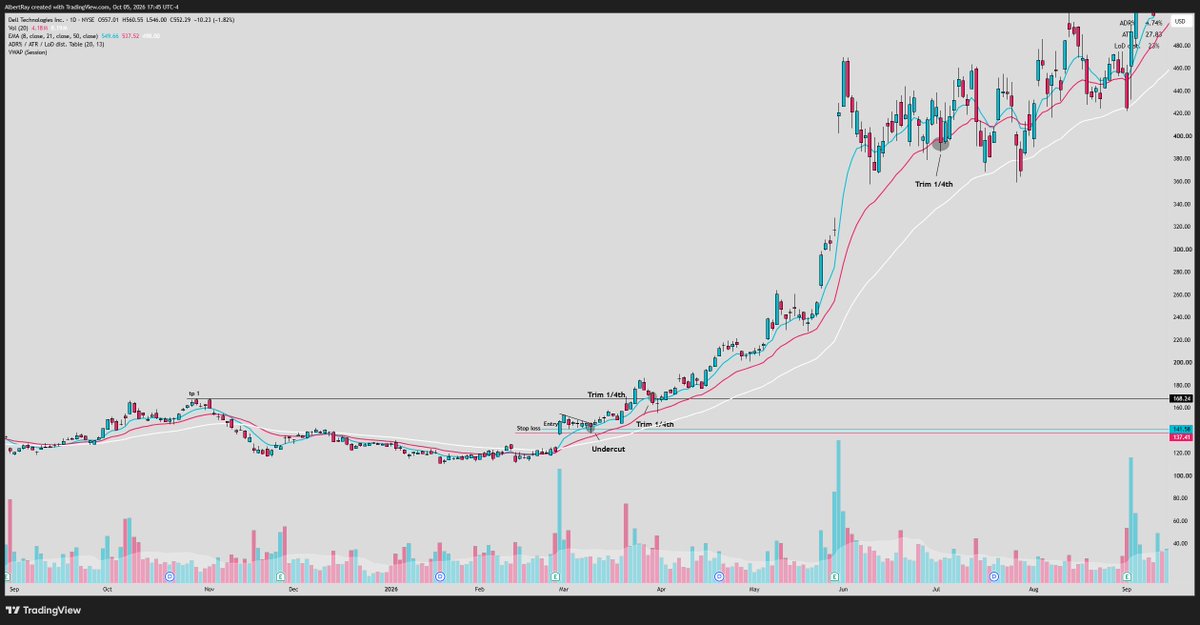
When a stock breaks the 21 EMA on a closing basis, I take another 25% off
This is telling you that the stock is likely running out of short-term/medium-term momentum and now it's going to the last line of defense, which is the 50 EMA.
Final exit When a stock breaks the 50 on a closing bases, I'm usually out of my full position
The beauty of this trimming strategy is it allows us to slowly lock in profits while keeping exposure on the table for more upside
The goal is to hold onto the trade until targets are hit or you are stopped out This will help you make trading emotionless
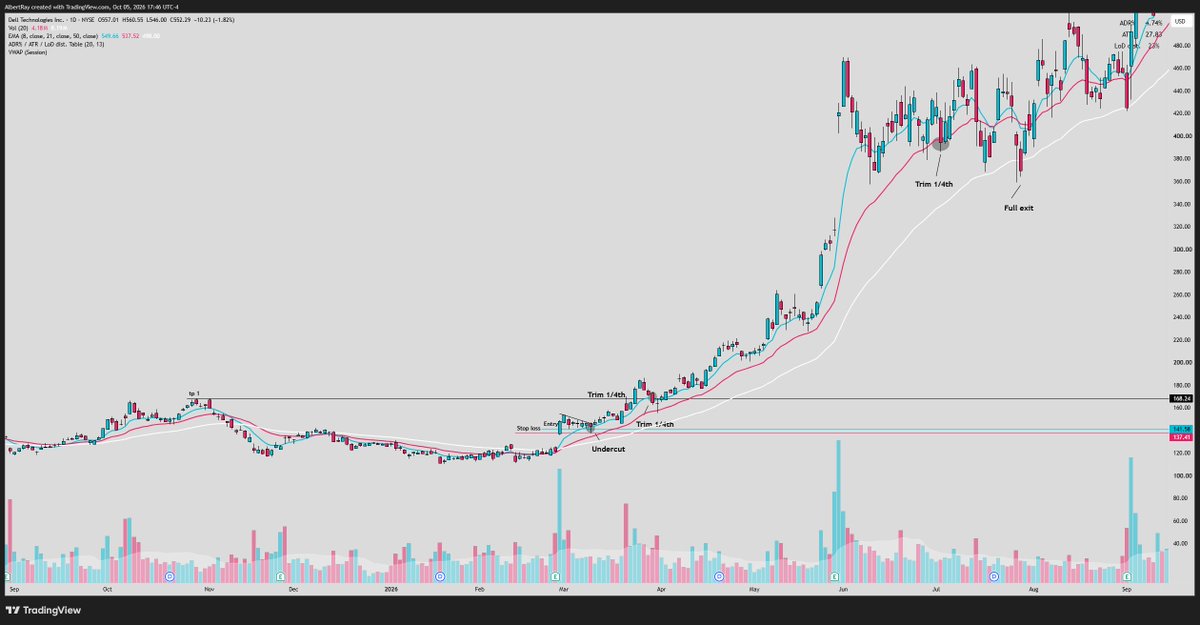
The beauty of this trimming strategy is it allows us to slowly lock in profits while keeping exposure on the table for more upside
It's never going to be perfect and you're not going to sell at the tippy top... I also like to trim into some extensions if we are extended from the moving averages, like a 3x extension from the 8 EMA.
BUT
The goal is to hold onto the trade until targets are hit or you are stopped out
This will help you make trading emotionless
Everything is preplanned and you are taking amazing risk to reward trades
Breakouts allow you to capture huge moves and using options contracts you can use the leverage they provide to risk small amounts of money for bigger hits
This works best when markets are very strong and setups are firing(above moving averages)
The reason this strategy works so well is because we are trading the stocks that are leading the market higher and emerging out of strong sectors and themes.
We are also taking advantage of the strongest environments in the markets when stocks are breaking out and following through
Like any other strategy this is not a holy grail strategy but there's a reason why some of the best traders in the world swing strong names, and buy leading stocks in leading sectors.
You don't need to catch every move in the market to make money.
You need to get really good at recognizing the same opportunities over and over again.
A strong market Leading stocks A tight setup
& a plan you can actually follow
Then when the trade works, give it time to pay you. When it doesn't, take the loss and move on.
The hard part is doing this consistently when real money is on the line.
That's why I want you to have a system... so you're not waking up every morning trying to figure out what the hell you're going to do.
Study the setups. Build your focus list. Know your levels. And let the market tell you when it's time to get involved.
If you read until the end, I could tell you're serious about making trading work and learning how to swing trade....
If you want to learn how to make your first profitable swing trade in 3 days register here for my live swing trading challenge: