How to Trade Time-Based Ranges
文章目录
部分视频或图片暂未收录,已在正文保留提示;需要时可查看原文。查看原文 ↗
In March I open-sourced a TradingView MCP: a bridge that lets Claude Code read and drive your TradingView Desktop charts. It hit 1,000 GitHub stars in its first week.
Today it's the most-starred TradingView MCP on GitHub. 6,700+ stars. 2,700+ forks. By my own tracking of GitHub's traffic charts, it's been cloned well over a million times, and it still picks up new stars almost every day.
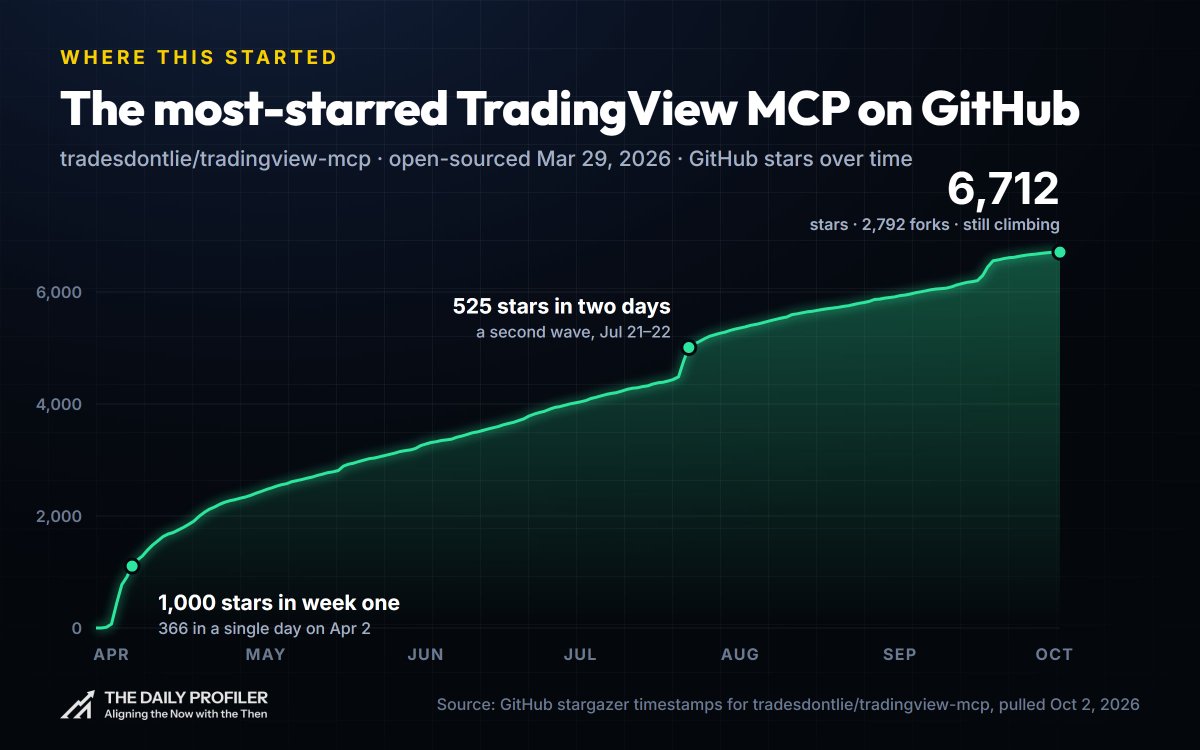
GitHub stars for tradesdontlie/tradingview-mcp since launch on March 29.
It was one of the first tools to plug an AI agent straight into the TradingView app. Now it's everywhere. Scroll X for five minutes and you'll see someone wiring TradingView into Claude, Codex or their own agent.
That project taught me one thing: traders don't want another opinion. They want the data, inside the tools they already use.
So that's what I built next.
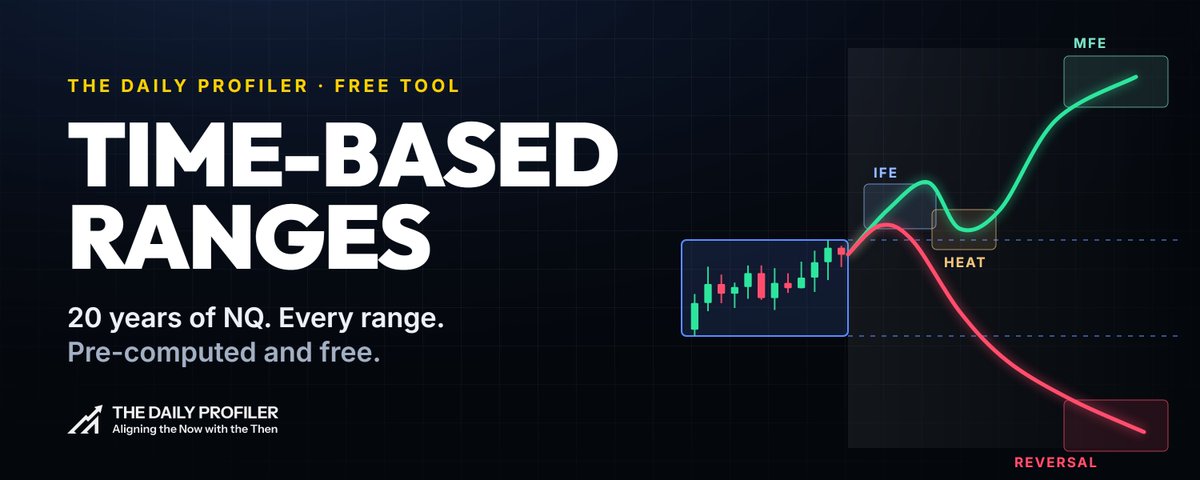
Every time-based range on NQ, pre-computed across 20 years, explained in plain English, and drawn straight onto your TradingView chart. Free.
Here's the kind of thing it shows you.
Watch the 7:30–8:30 range on NQ for one hour after it closes, and it reverses 18% of the time. Watch the same range for four hours, and that number jumps to 69%.
Same range. Same 20 years. One setting changed.
I pre-computed every time-based range on NQ. Every start time in 5-minute steps, from the 6 p.m. Globex open through the afternoon. Range lengths from 15 minutes to 4 hours. Observation windows from 30 minutes to 8 hours. 5,125 sessions, January 2006 to September 2026.
That's more than 169,000 range and window combinations, and each one answers the same question:
When this range breaks, what happens next?
All of it is free: the website, the statistics, and the TradingView indicator. In this article:
-
What a time-based range is, and 3 things 20 years of data taught me
-
How a continuation and a reversal actually unfold, on real charts
-
The two settings that change everything
-
4 blueprints to start with
-
How to put all of it on your TradingView chart
Bookmark this one. It's a reference.
Time is the constant. Price is the variable.
A time-based range is simple. Pick a slice of the clock, say 9:30 to 10:00 ET. Mark the high and the low. That's your range.
Then pick an observation window: how long you'll watch after the range closes. Say, until 11:00.
Same slice of time every day. Same window every day. Now every session is directly comparable to every other session in 20 years of history.
When price breaks one edge of the range, one of three things happens before the window closes:
-
Continuation. It breaks out, pushes, pulls back, then makes a new high beyond that first push. It never crosses the other side of the range.
-
Reversal. It comes back through the range and crosses the opposite edge.
-
Unresolved. Neither happens before time runs out.
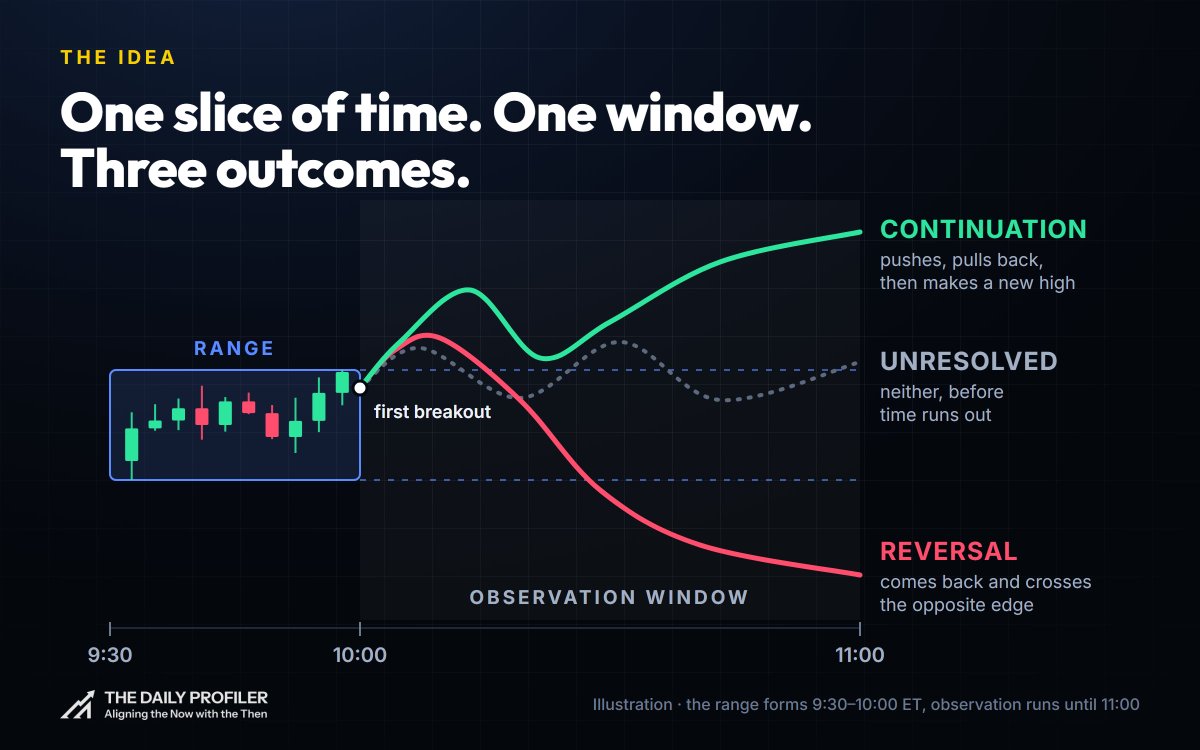
One slice of time, one window, three possible outcomes.
Most people trade ranges on a feeling. "The opening range usually holds." "London sweeps Asia." Maybe. But how often? How far? When?
That's what the data answers.
What you actually get
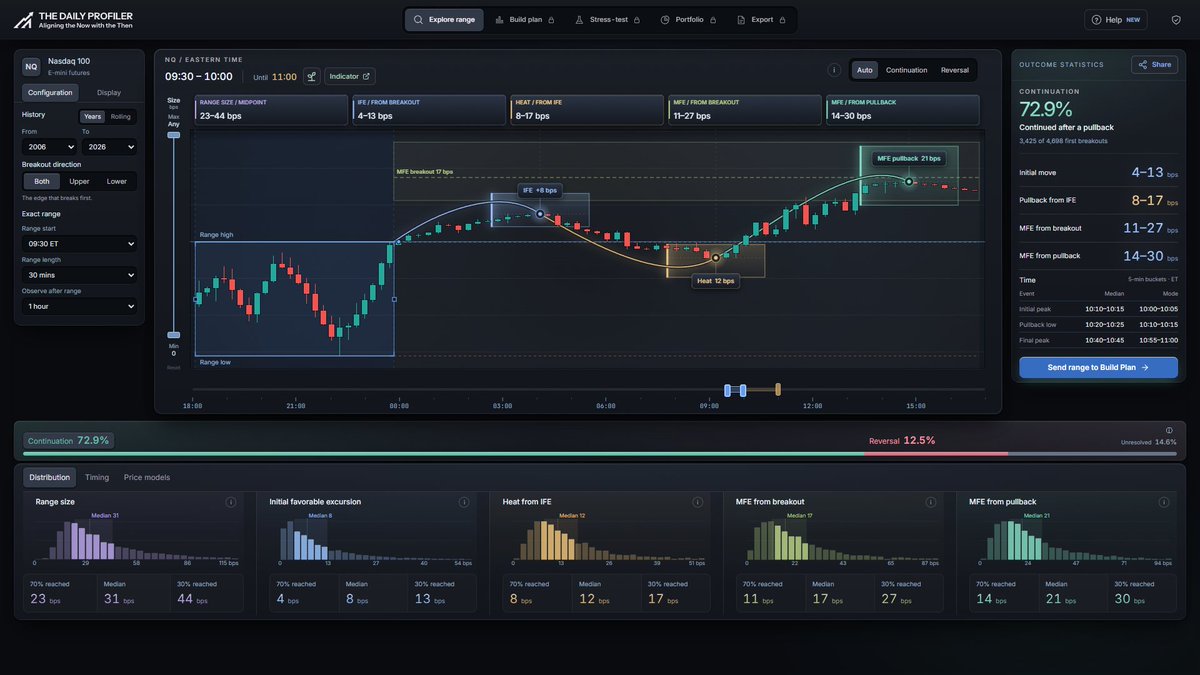
Explore range on The Daily Profiler. 9:30–10:00 ET, watched for one hour.
Pick any range, and you instantly see:
-
How often it continued, reversed, or stayed unresolved
-
How far the first push went, how deep the pullback got, and how far the whole move ran
-
How far the fake-out went before a reversal, and how far the reversal ran
-
When each of those things usually happened, in 5-minute buckets
-
How all of it changes when you filter by range size
This isn't one cherry-picked chart. Every range is built from thousands of sessions.
3 things 20 years of data taught me
1. The longer you watch, the more ranges reverse.
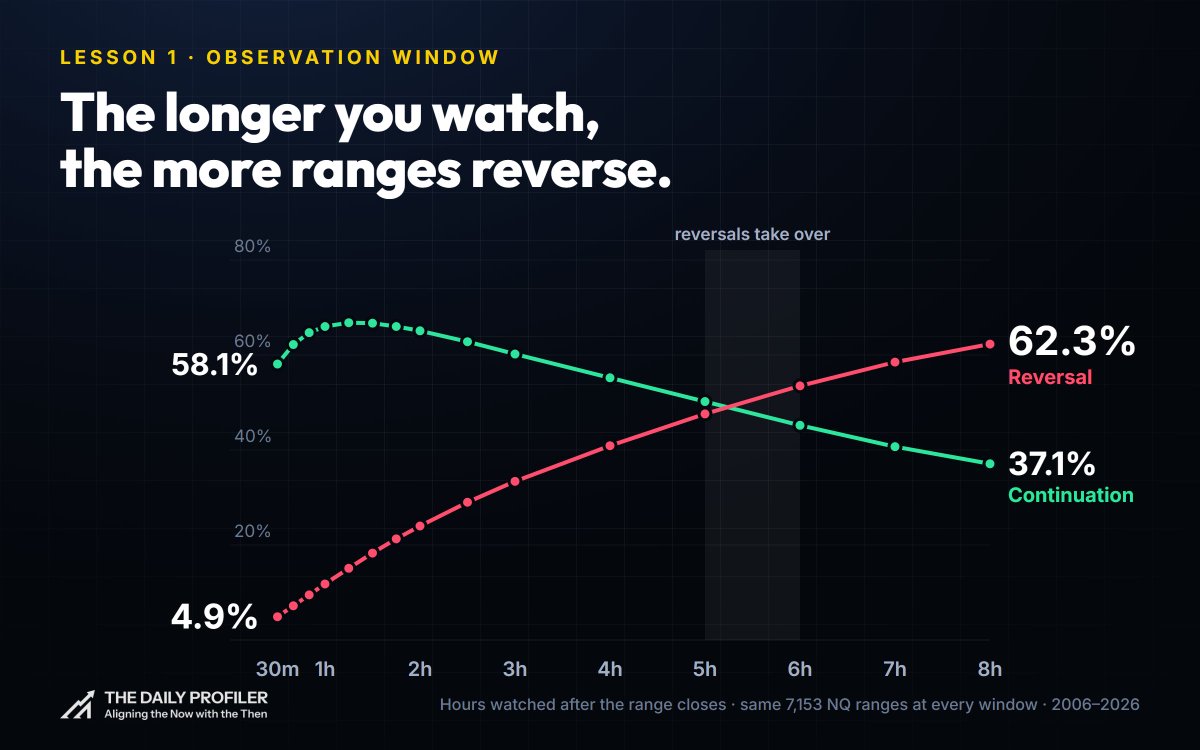
The same 7,153 ranges, watched for longer and longer.
I took every range that can be watched for a full 8 hours. That's 7,153 of them.
Watch each one for 30 minutes after it closes, and only 4.9% reverse. Watch for 2 hours: 24%. Watch for 8 hours: 62%.
Somewhere between 5 and 6 hours, reversals overtake continuations.
It makes sense once you see it. More time means more chances for price to come back through the other side. Your observation window isn't a detail. It's the question you're asking. "Does the opening range hold until lunch?" and "Does it hold until the close?" are two different trades.
2. Short ranges reverse more.
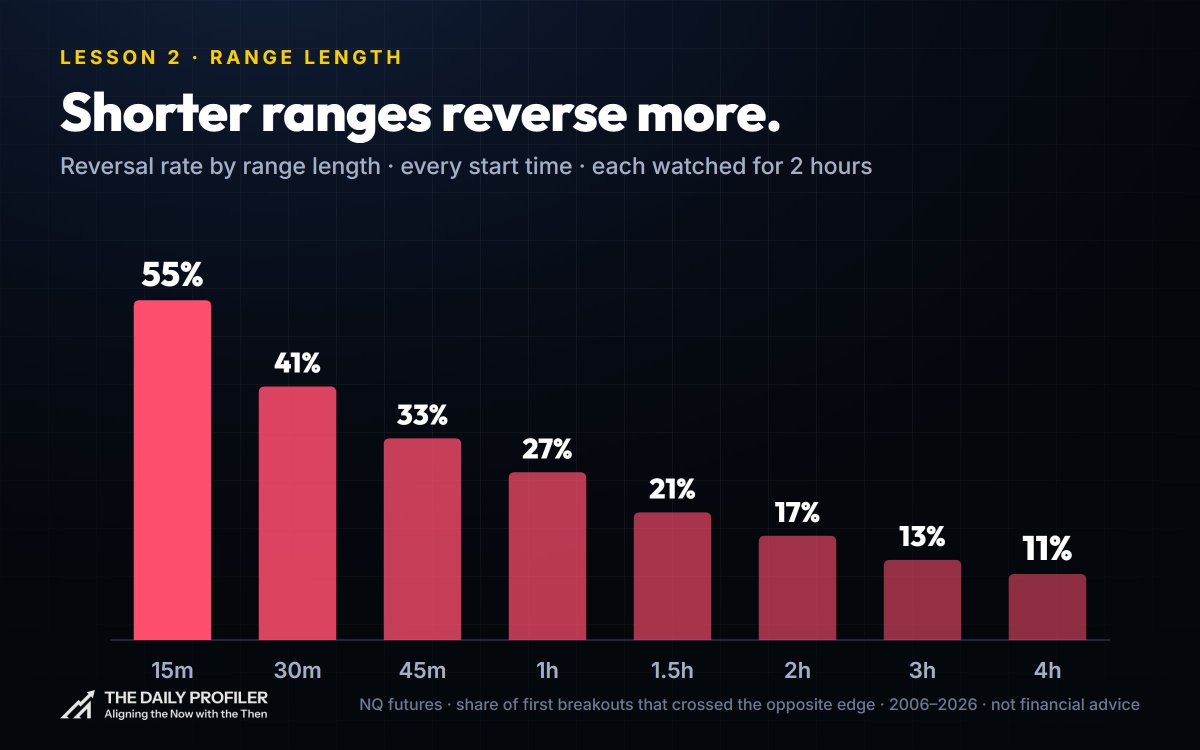
Reversal rate by range length, every start time, each watched for 2 hours.
Same 2-hour window, across every start time of day:
-
15-minute ranges reverse 55% of the time.
-
1-hour ranges reverse 27% of the time.
-
4-hour ranges reverse 11% of the time.
A short range captures a small slice of the day. It's easy to break, and just as easy to break back through.
3. Small ranges reverse more.
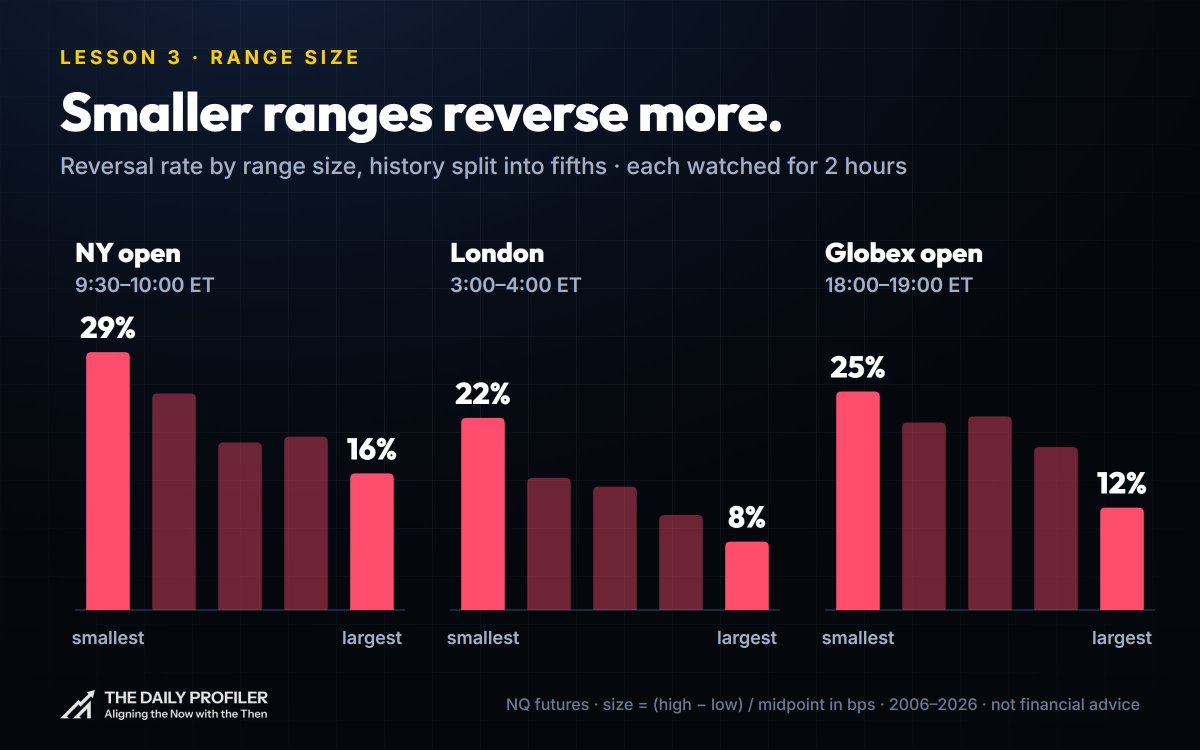
The smallest fifth of ranges reverses about twice as often as the largest.
This one is about size, not time. Range size is measured in basis points, so a 2010 range and a 2026 range compare fairly. At today's price of about 31,000, 10 bps on NQ is roughly 31 points.
I split each range's history into fifths by size and watched each for 2 hours. In every session I checked, the smallest ranges reversed about twice as often as the largest:
-
9:30–10:00 NY open: 29% vs 16%
-
3:00–4:00 London: 22% vs 8%
-
18:00–19:00 Globex open: 25% vs 12%
Put all three lessons together, and you get a map.
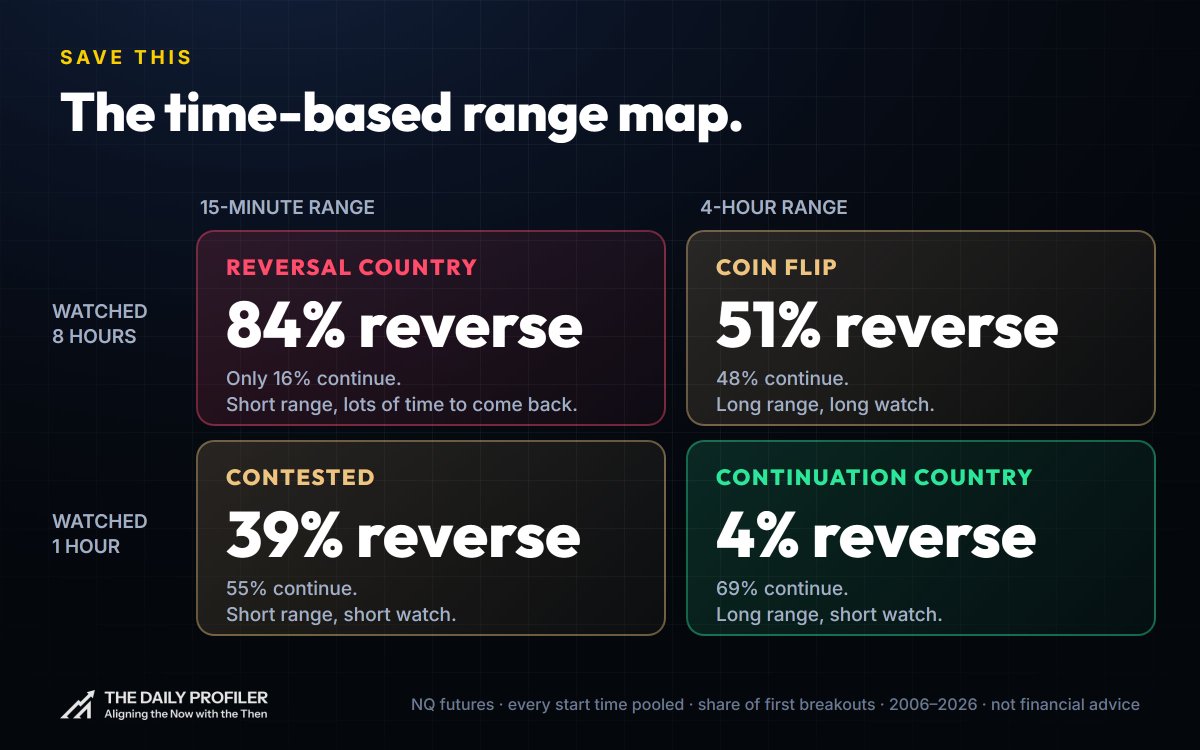
Save this. Short ranges watched for a long time live in reversal country. Long ranges watched briefly live in continuation country.
Anatomy of a continuation: IFE, Heat, MFE
Knowing a range tends to continue isn't enough. You need to know where.
Every continuation in the dataset is broken into measured legs:
-
IFE (initial favorable excursion). The first push out of the range: from the broken edge to the high it made before the deepest pullback.
-
Heat. That pullback. How far price came back from the IFE before the move resumed.
-
MFE (maximum favorable excursion). How far the whole move ran before the window closed. Measured from the breakout and from the pullback.
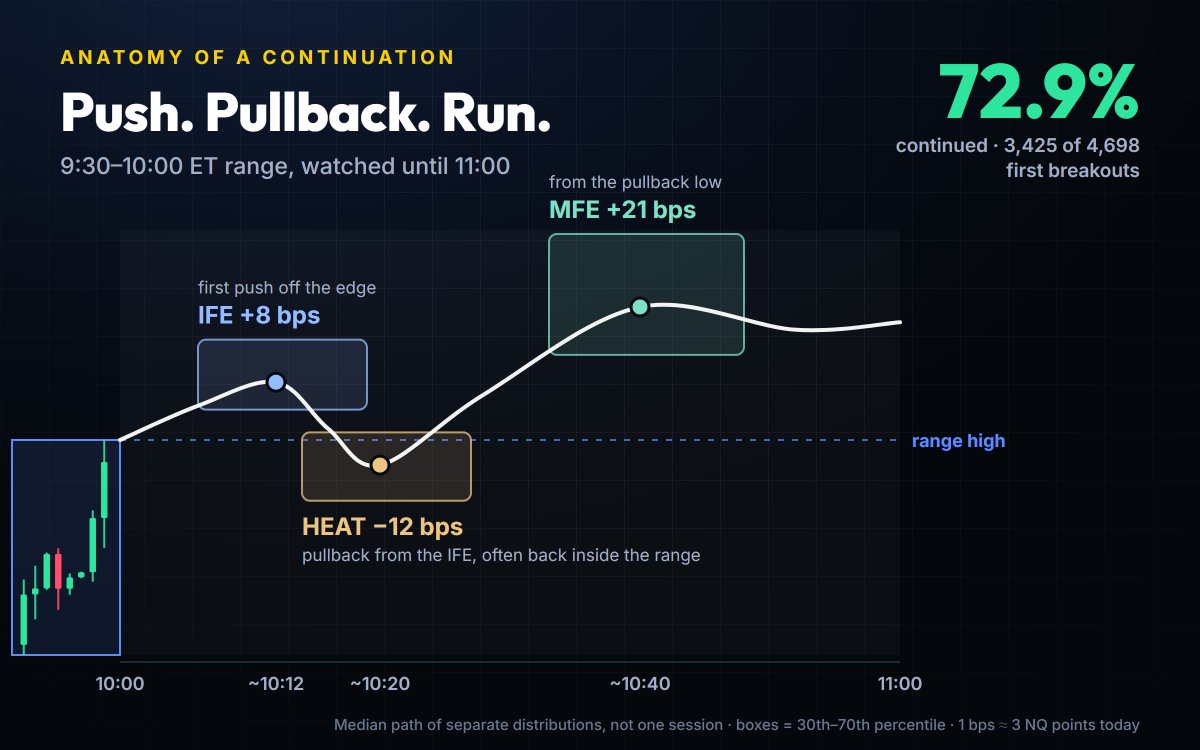
9:30–10:00 ET, watched until 11:00. Boxes show the middle 40% of history.
Take 9:30–10:00 watched until 11:00. 72.9% of 4,698 first breakouts continued. The typical one:
-
pushed 8 bps (about 23 points) past the edge, peaking around 10:12
-
pulled back 12 bps from that push, bottoming around 10:20
-
then ran 21 bps from the pullback low, peaking around 10:40
Here's the part that surprised me: in more than half of these continuations, the pullback dipped back inside the range before the move resumed.
If you keep getting stopped out on the retest, that's why. The retest is normal.
Every number comes as a band, not a single point: the 30th to 70th percentile, the middle 40% of history. For this range: IFE 4–13 bps, Heat 8–17, MFE from the pullback 14–30.
Here are the same three steps on a real chart. This one is a bigger range, 9:50–10:10 on a day when it was over 30 bps wide, so every zone is bigger. More on why in a minute.
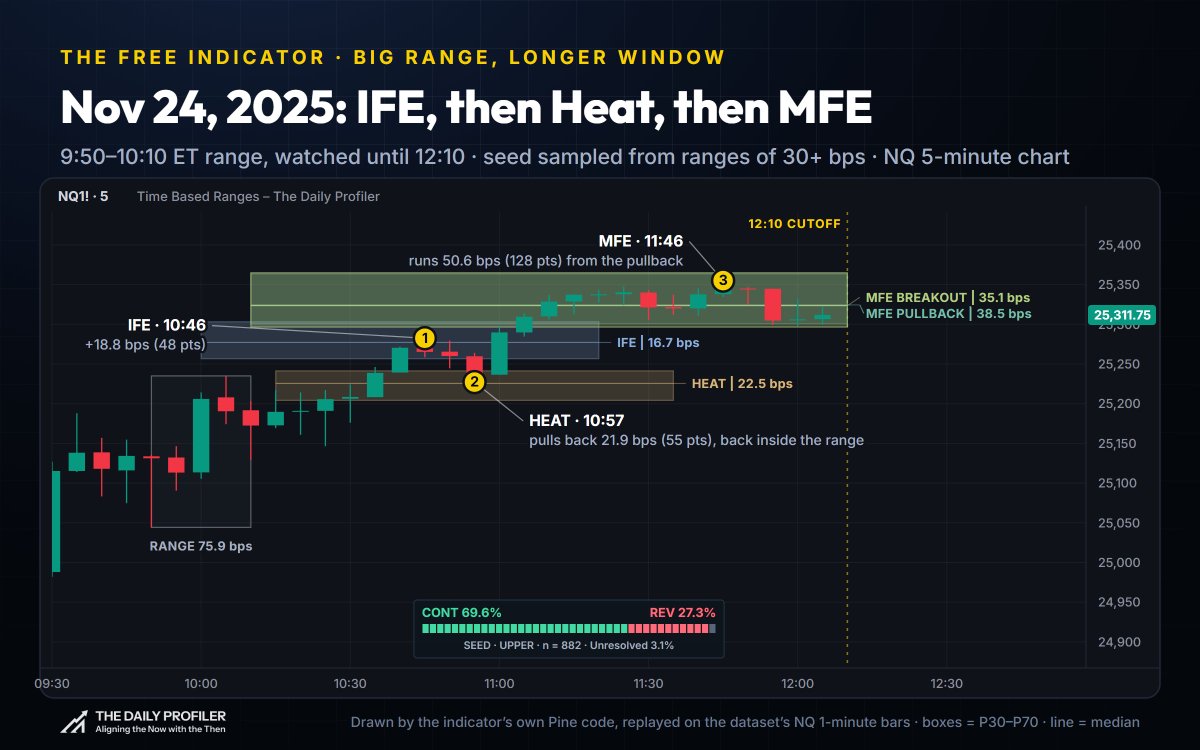
Nov 24, 2025. The range broke high at 10:36. Price pushed 18.8 bps (48 points) into the IFE zone, pulled back 21.9 bps (55 points) into the Heat zone, back inside the range, then ran 50.6 bps (128 points) from the pullback by 11:46.
Push. Retest. Run. The retest went back inside the range, exactly like the statistic says it often does.
Anatomy of a reversal: the turtle soup, measured
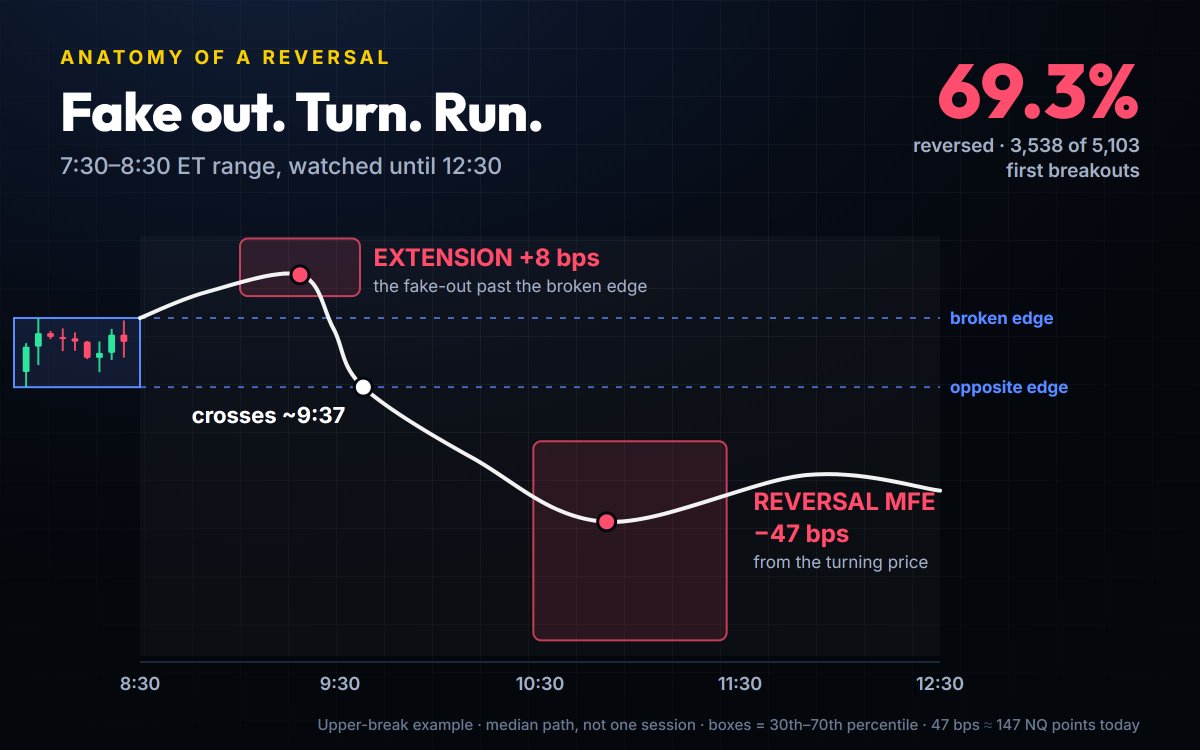
7:30–8:30 ET, watched until 12:30. Upper-break example.
Back to the range from the top: 7:30–8:30, watched until 12:30. 69.3% of 5,103 first breakouts reversed.
A reversal has its own map:
-
Reversal extension. How far price ran past the broken edge before it turned. Median 8 bps, with a band of 4–15. That's the fake-out, the turtle soup, measured across thousands of sessions instead of eyeballed on one chart.
-
Reversal IFE and Heat. After the turn, the first push in the new direction (median 31 bps from the turning price) and the pullback from that push (median 18 bps).
-
Reversal MFE. How far the reversal ran from the turning price before the window closed. Median 47 bps, about 147 points at today's prices.
And then there's timing.
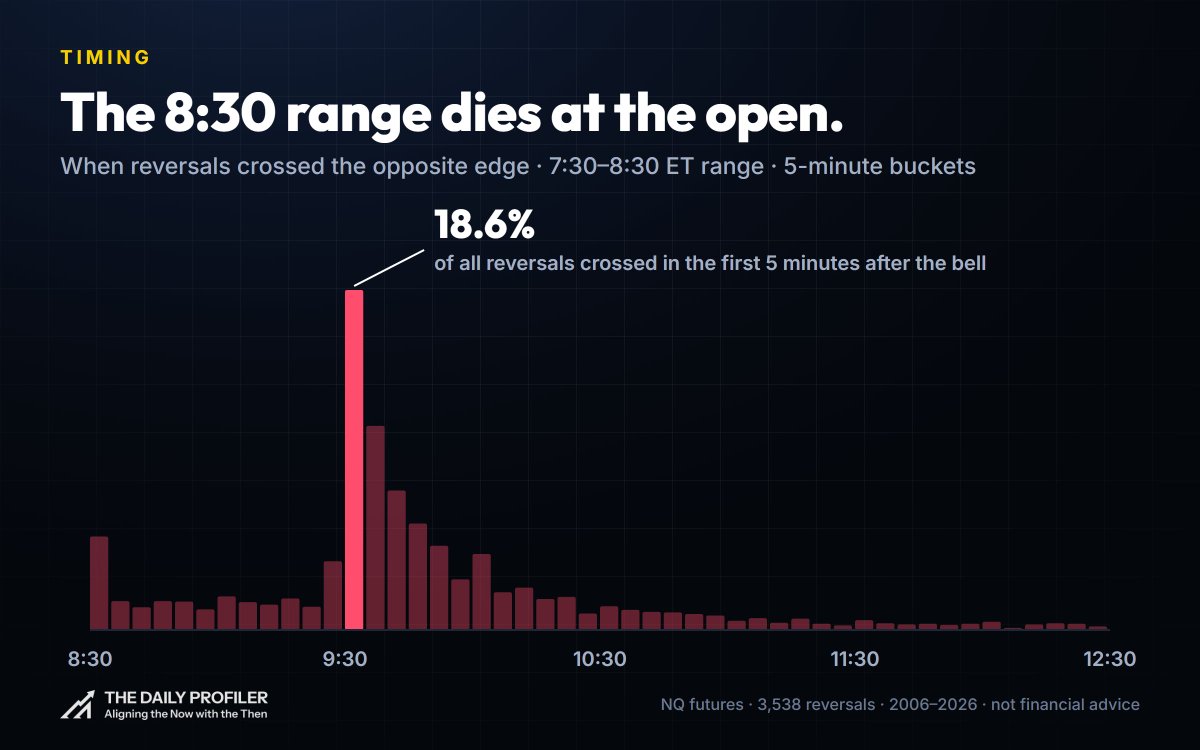
When reversals crossed the opposite edge, in 5-minute buckets.
Look at when those reversals crossed the opposite edge. 18.6% of them crossed in the first five minutes after the 9:30 bell. Half of them crossed between 9:30 and 10:00.
That's why the one-hour window, which ends at 9:30, shows 18% and the four-hour window shows 69%. The 8:30 range doesn't die at random. It dies at the open.
Here's one from this week.
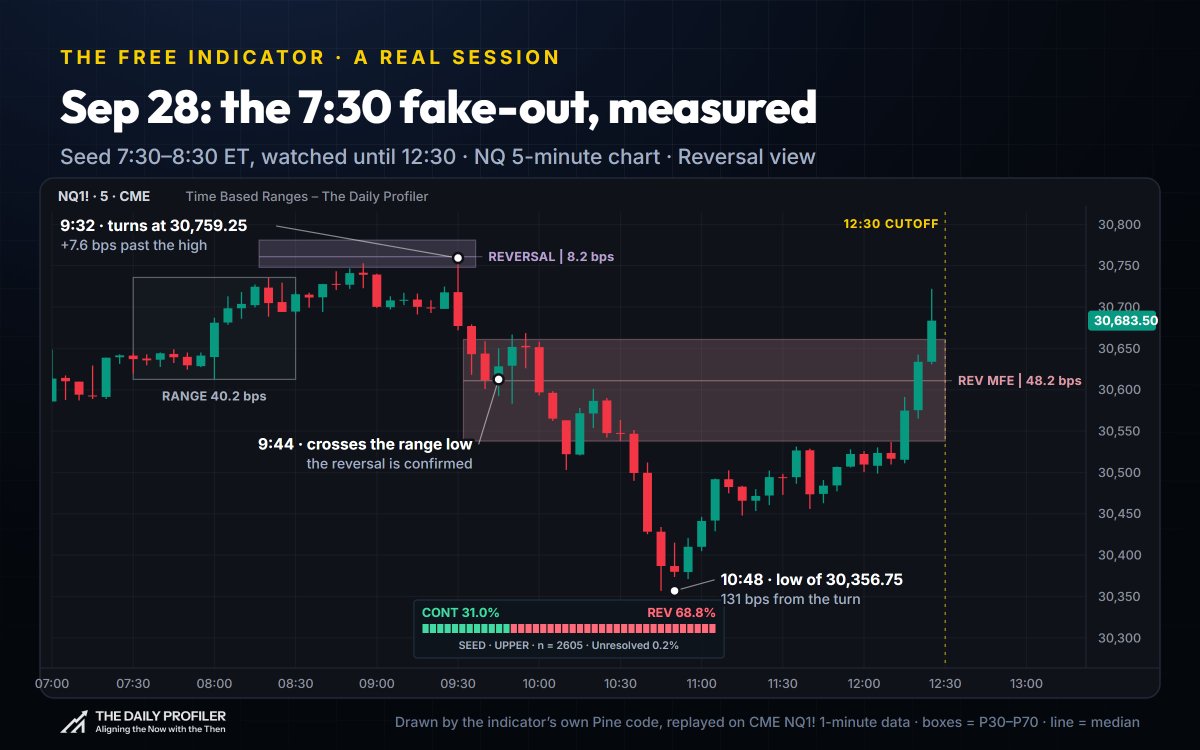
Sep 28, 2026. The range broke high at 8:45 and turned at 9:32, just 7.6 bps past the edge and inside the reversal zone. It crossed the low at 9:44 and ran 131 bps from the turn. Historically, 68.8% of upper breaks of this range reversed.
The Timing tab shows this for every leg: when the IFE peaks, when the Heat bottoms, when the MFE prints, and when a reversal crosses.
The two settings that change everything: size and window
Compare today to days like today
This is the move I use most.
Say today's 9:30–10:00 range is 40 bps wide. Is it fair to compare it to days when the range was 12 bps? Probably not.
So drag the minimum size slider up to today's size. Every statistic recalculates using only days at least that big. Drag the maximum down to trim the outliers on the other side.
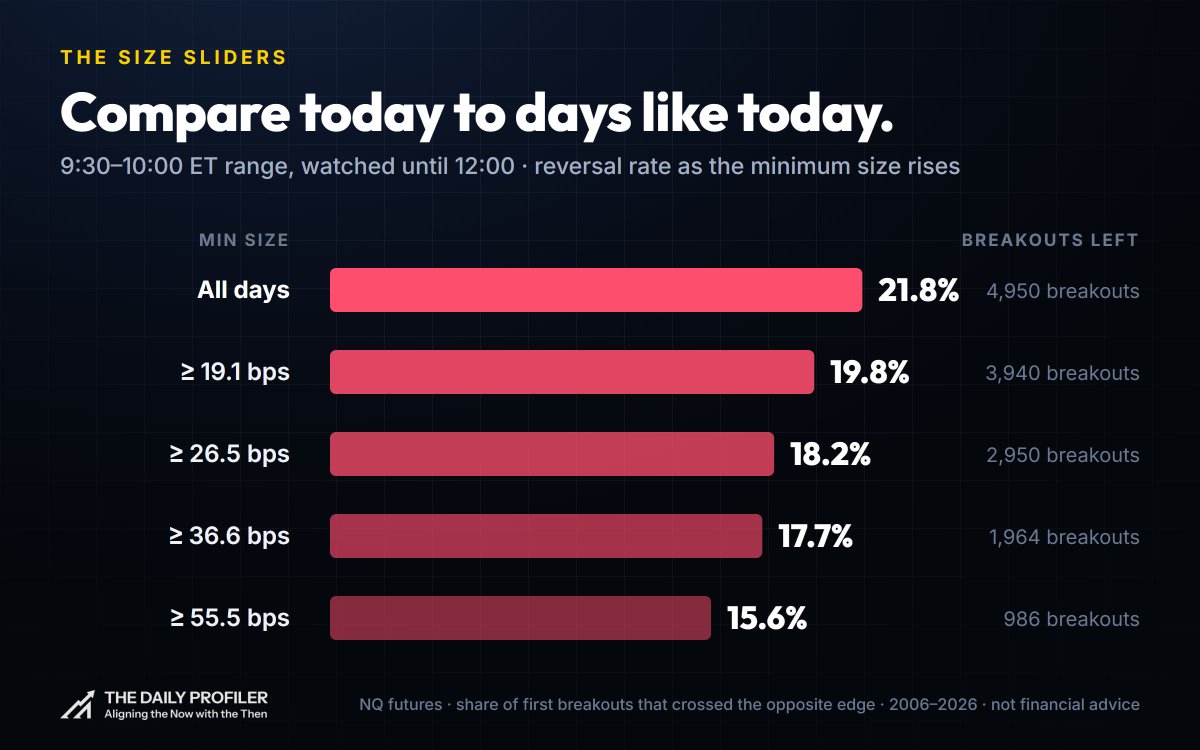
9:30–10:00 ET, watched until 12:00. Raising the minimum size changes the odds.
On 9:30–10:00 watched until 12:00:
-
All days: 21.8% reversed
-
Ranges of at least 26.5 bps: 18.2%
-
Ranges of at least 55.5 bps: 15.6%
Bigger days, bigger zones
The size filter doesn't only change the odds. It changes how far price travels.
Take the 9:50–10:10 range. Keep only days when it was at least 30 bps wide, and every zone gets 1.6 to 1.8 times bigger. Then watch until 15:10 instead of 12:10, and the zones grow again.
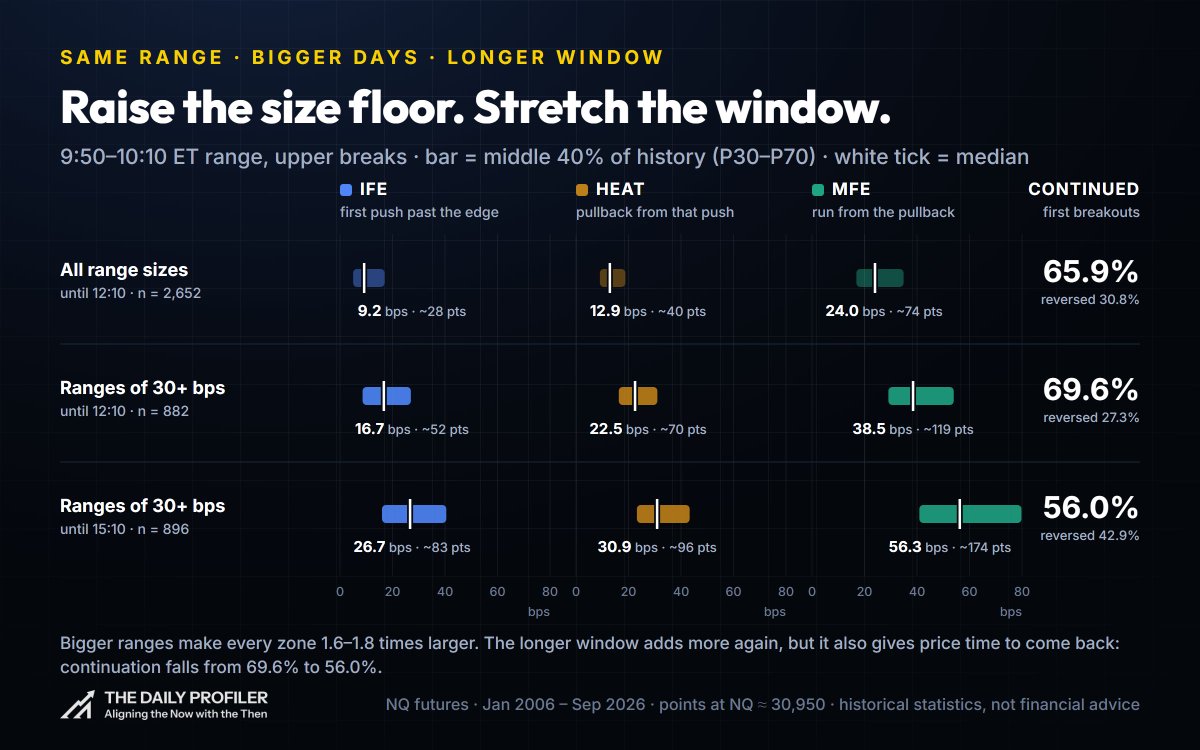
9:50–10:10 ET, upper breaks. Bars show the middle 40% of history; the white tick is the median.
For upper breaks, the median run from the pullback goes from 24 bps (all days, until 12:10) to 38.5 bps (30+ bps days, until 12:10) to 56.3 bps (30+ bps days, until 15:10). That last one is about 174 points at today's prices.
But nothing is free. The longer window gives price more time to run, and more time to come back. Continuation falls from 69.6% to 56.0%. That's lesson 1 again, in a single range.
Here's what the long version looks like.
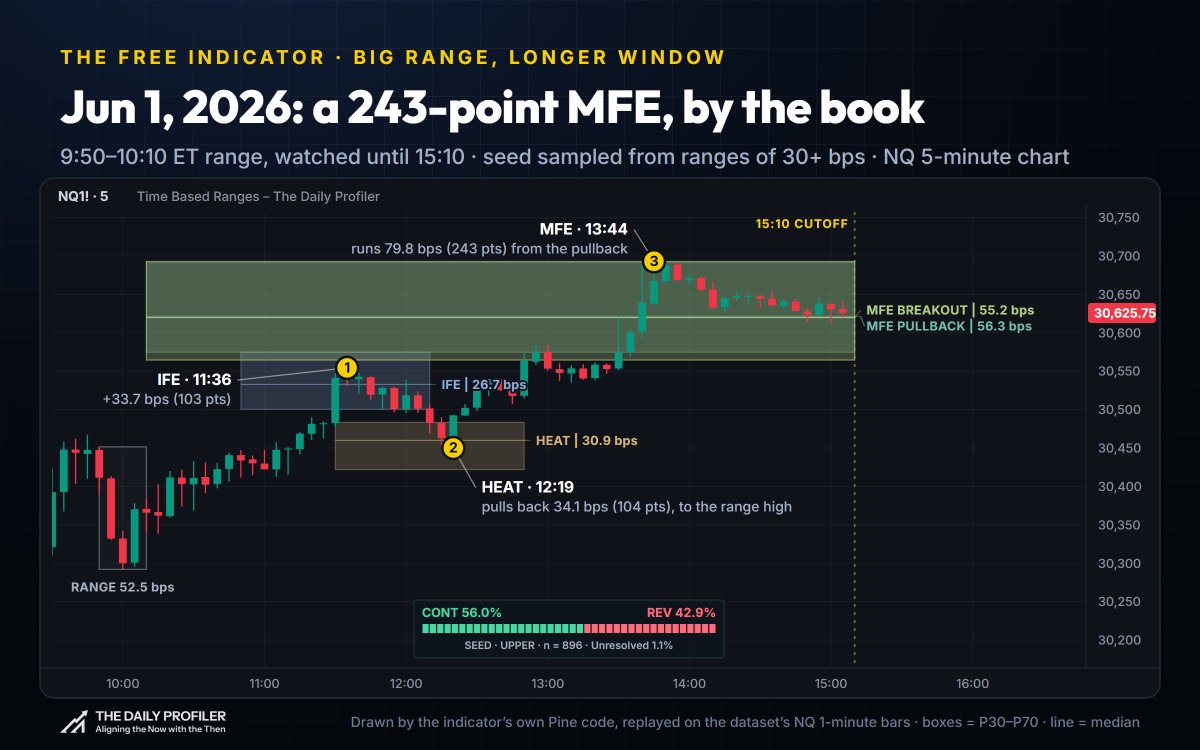
Jun 1, 2026. 9:50–10:10, 30+ bps days, watched until 15:10. Price pushed 33.7 bps (103 points), pulled back 34.1 bps (104 points) to the range high, then ran 79.8 bps (243 points) from the pullback by 13:44, the top of the MFE zone.
Every filter shows how many breakouts are left. A 30 bps floor on this range still leaves about 880 upper breakouts in 20 years. Push the floor too high and you're reading a handful of days, so watch that number.
4 blueprints to start with
These aren't signals. They're starting points. Pull them up, poke at them, and disqualify them if they don't hold up for you.
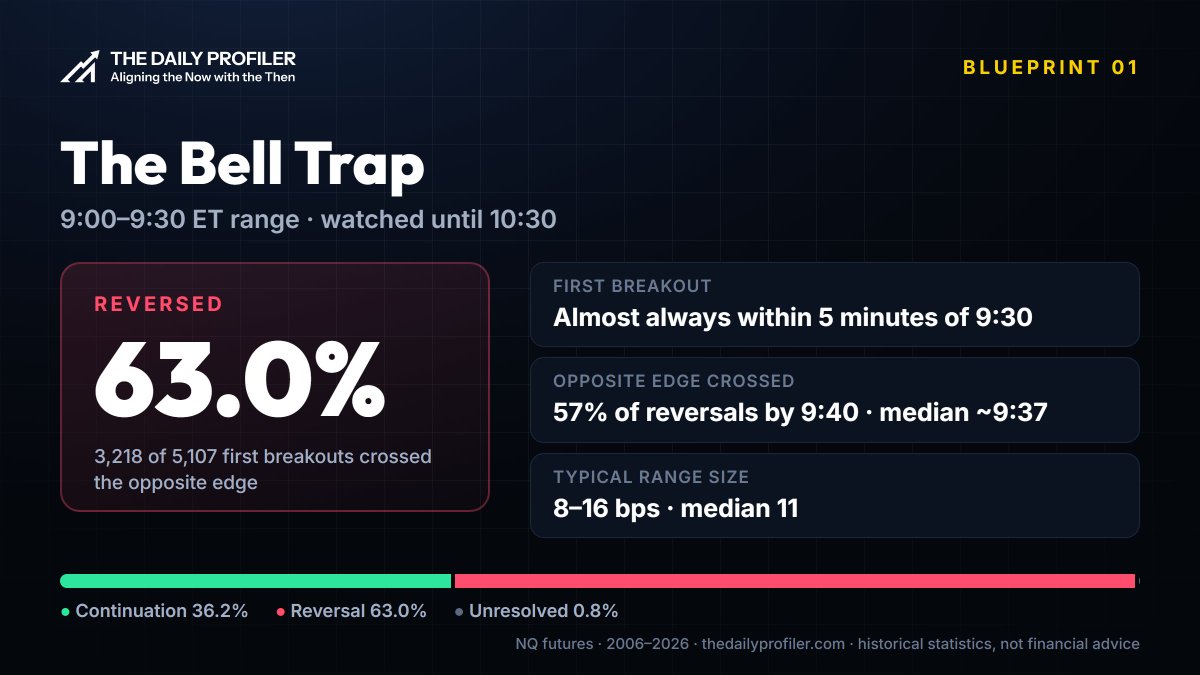
The Bell Trap: 9:00–9:30, watched until 10:30. 63.0% of first breakouts reversed. The breakout almost always comes within five minutes of the open, and 57% of the reversals crossed the opposite edge by 9:40. The half hour before the bell gets swept both ways.
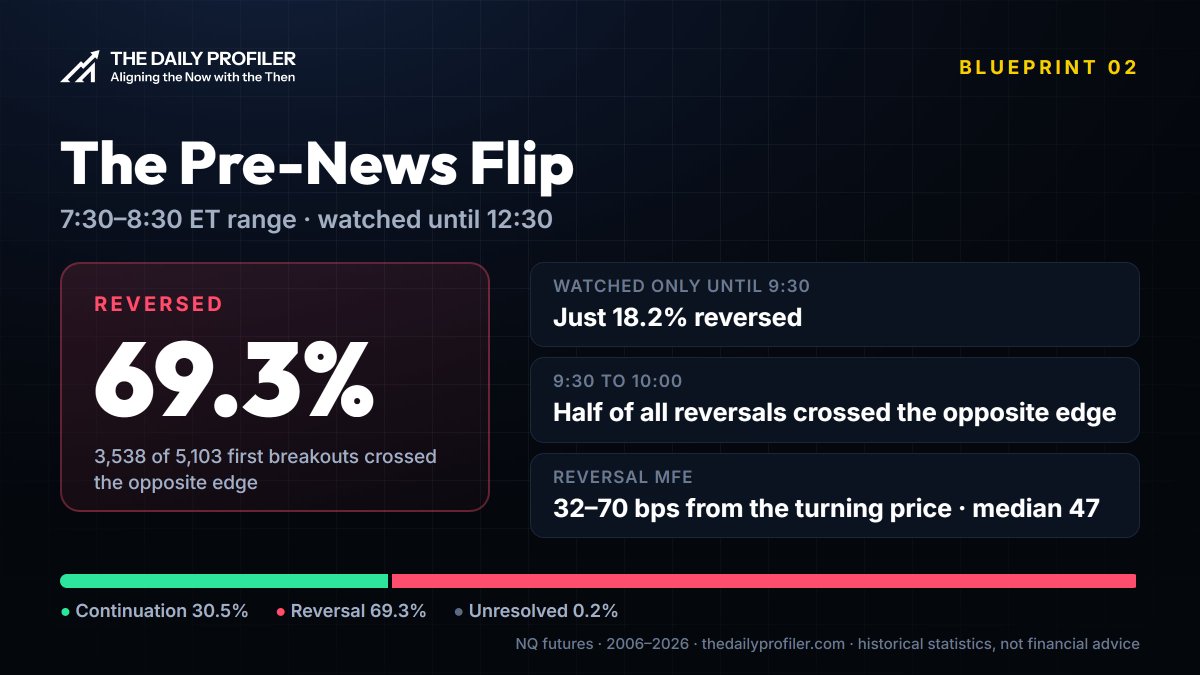
The Pre-News Flip: 7:30–8:30, watched until 12:30. 69.3% reversed. Most of the damage happens right after 9:30.
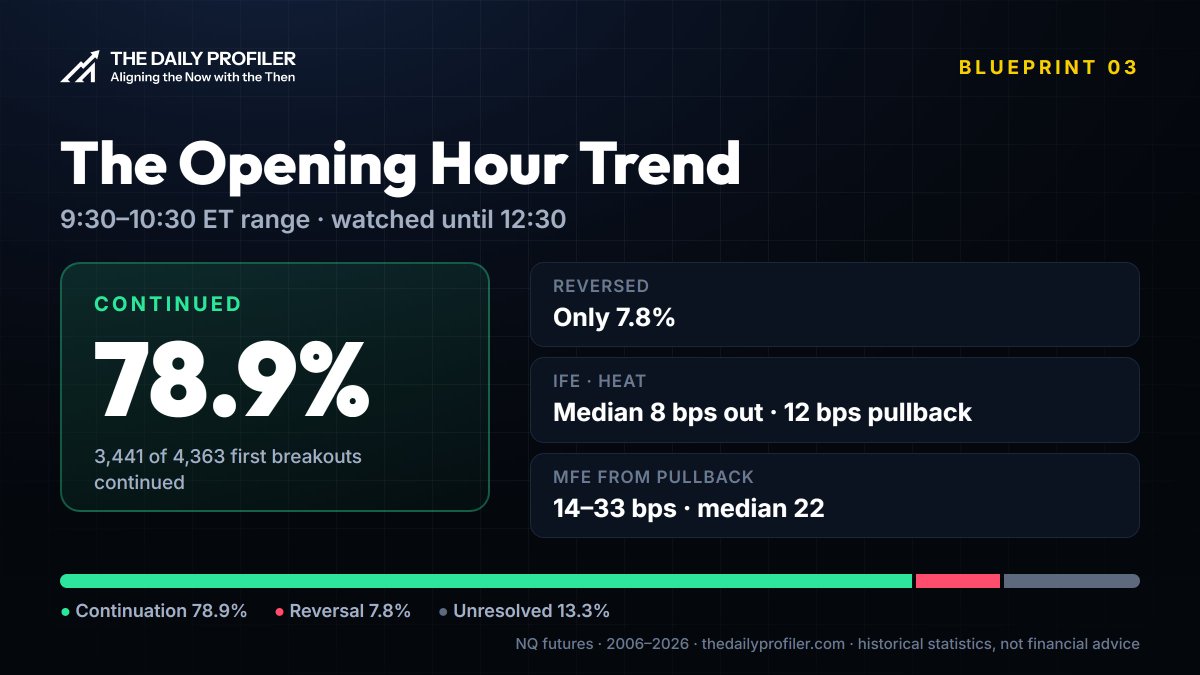
The Opening Hour Trend: 9:30–10:30, watched until 12:30. 78.9% continued, and only 7.8% reversed.
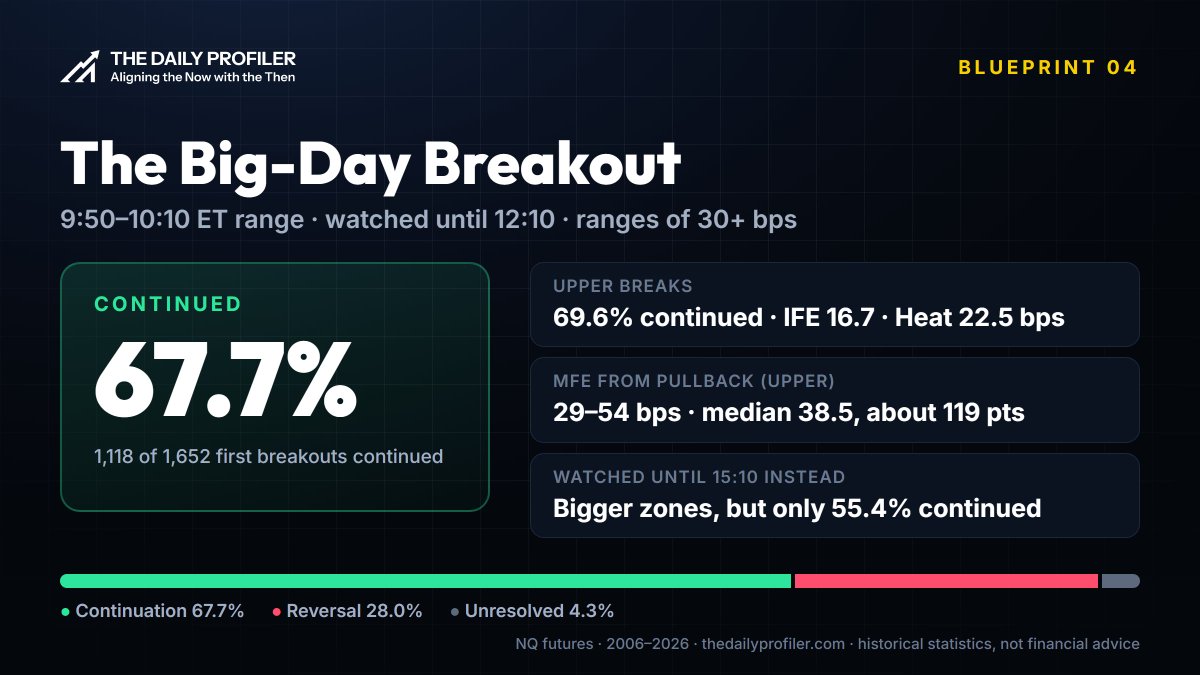
The Big-Day Breakout: 9:50–10:10, only ranges of 30+ bps, watched until 12:10. 67.7% of 1,652 first breakouts continued, with bigger zones than the all-days version. Watch until 15:10 and the zones grow again, but continuation falls to 55.4%.
Change one input on any of these and watch the numbers move. That's the point.
Take it straight to TradingView
There's a free indicator: Time Based Ranges – The Daily Profiler.
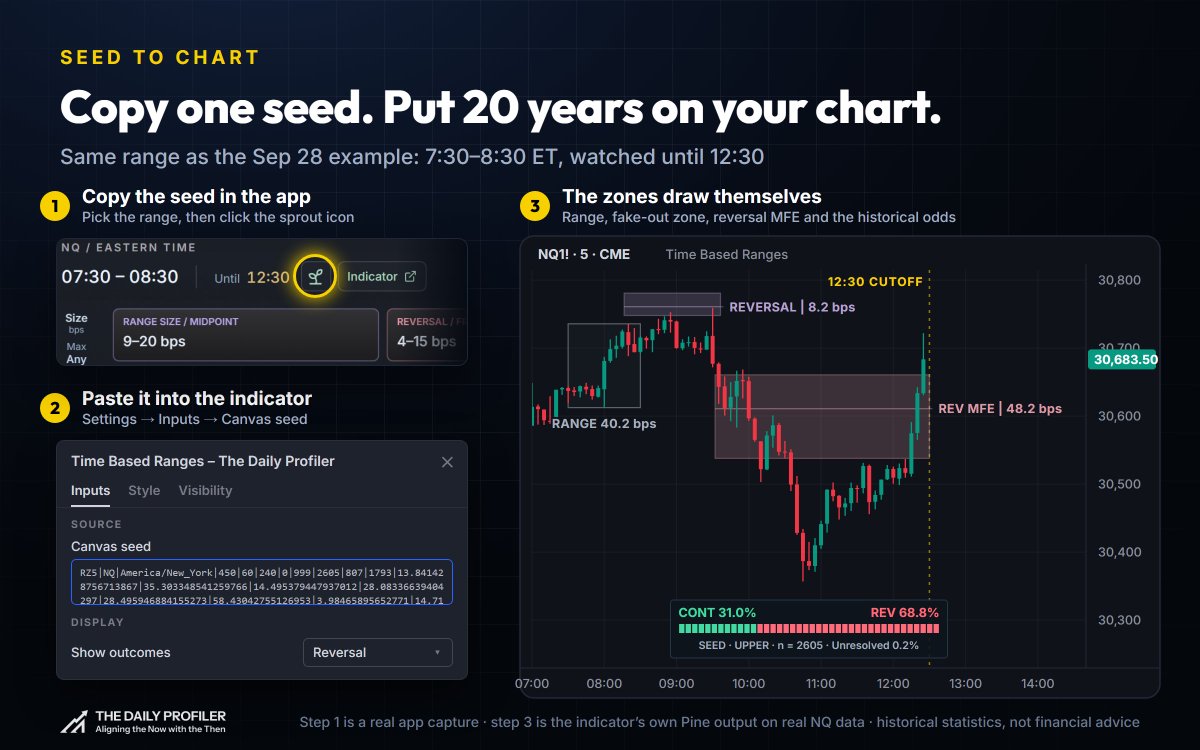
Copy one seed in the app, paste it into the indicator, and the zones draw on your chart.
-
Pick your range in the app, including the size filter.
-
Copy the seed with one click.
-
Paste it into the indicator settings.
The same statistics now draw live on your chart: the IFE, Heat and MFE zones, the reversal zone, and the historical continuation vs reversal split for the edge that broke first. The Heat zone trails the running high as the breakout extends. Choose whether it freezes on the first touch or keeps trailing.
Every real chart in this article was drawn by the indicator's own code. I picked those sessions because each zone is easy to see. Most days are messier, which is why the zones are ranges and not lines.
Copy a new seed whenever you change the range, the window or the size filter.
Why it's free
Pre-computing this was not small. 20 years of one-minute data, every range, every window, every excursion, every timing bucket.
It's free for the same reason the MCP is open source: give away the work, and let it earn your trust. And because I'm tired of people trading time-based ranges on someone else's word. Including mine.
The MCP put your TradingView charts in front of an AI agent. This puts 20 years of NQ in front of you.
You shouldn't need to trust anyone's favorite window. You should be able to qualify or disqualify any range yourself, in seconds, with 20 years of evidence behind it.
Go to thedailyprofiler.com, sign in for free, and open Explore range. New to it? This walkthrough takes two and a half minutes.
Then reply with the range you trade: start time, length, and how long you watch it. I'll pull its numbers.
None of this is financial advice. It's historical observation of NQ futures from January 2006 to September 2026, shared for research and education. Past results don't predict future results. The statistics come from one-minute bars, which can't establish the order of every event inside a bar. The chart examples were selected to show each zone clearly and are not typical sessions. Futures trading involves substantial risk of loss. Explore it, question it, and make your own decisions.