Decoding +convexity: Here's (part of) the rule and how to trade it
文章目录
部分视频或图片暂未收录,已在正文保留提示;需要时可查看原文。查看原文 ↗
+convexity is a Hyperliquid vault with a 12 month return of 82%, and a YTD Sharpe of 2.12, and we were able to decode 70% of it and turn it into a tradeable signal. Unlike the mean reversion vault we decoded last time, +convexity does the opposite: it's a trend follower. We were able to find it's core rule, and reproduce much of it's PnL curve, but missed out on figuring out it's exact sizing model. Despite that, we managed to turn their rule into a tradeable signal.
This is going to be a long article, so here's the tl:dr:
-
+convexity is a BTC only Hyperliquid vault that's been running for the last 15 months. We built it's whole history: 4,871 fills, 10,000 funding payments, and 1700 deposits and withdrawals. With deposits and withdrawals filtered out, it's returned 90% in the last 15 months, at a lifetime Sharpe of about 1.8
-
It trades once a day at 1:45:06-10 UTC, with a limit order. There are no stops and no intraday trading
-
We decoded about half of the vault, but the half we couldn't decode is a size tilt of ±50–100% that builds on the rule below. We tried to dissect it using every bit of public data we could, but to no luck. We did figure out though that the size tilt isn't a daily signal, rather 90% of it's PnL comes from the ~10% of days with the biggest moves in $BTC. On those days, we were able to figure out that the vault tends to lean against OI/funding which may signal it tries not to stay in crowded trades and we validated that against unseen data and a shuffle test (more on that below)
-
The half we were able to decode, we turned into a signal and ported it to 6 years of Binance perps (2020-2026, 650 coins incl. delisted ones). Their scoring works as a cross-sectional ranking and a 50/50 combination of the $BTC rule and and a top 10-30 cross sectional sleeve has a Sharpe of 1.63 gross and is positive in every regime.
-
The half we decoded is one of it's core rules:
[未转换内容,参见原始 JSON]
This basically means the target leverage is the trend strength multiplied by how busy the market is, divided by how risky it is. The trend term takes a moving average of the last 2 days and divides it by it's last 20. If the fast ema is above the the long one, the vault leans long, and if the opposite, the vault leans short.
The volume term scales up the sizing based off how 'busy' the market is, they bet that a trend that contains more volume is more likely to be real, so they size it more. The σ^2 term represents the variance of $BTC: when it's more volatile, they shrink the position shrinks which is mean-variance (Kelly-style) sizing.
How?
We treated this like a math problem and reconstructed all of it's trades and activity, then tries to decompose it into it's pieces, and then validate it exhaustively to make sure that it isn't just selection fit/chance, and lastly test out of sample. We took +convexity's sizing and every possible piece of data we had, and tried to match the outputs (their positions on any day) with our inputs (deconstructed rule from the data). We'll break down the math and also explain it in simple english so that you guys can understand what we did and then show you how you can trade it!
We fit this on Aug 2025 - Mar 2026, and then tested it on Mar 2026 - Nov 2026
Rebuilding the Vault
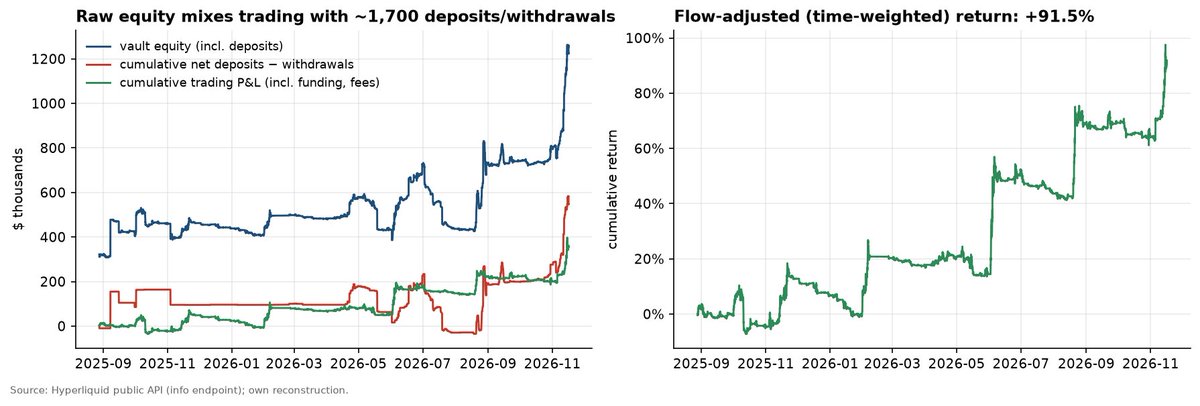
The first thing we did was strip out deposits and withdrawals from the PnL curve. +convexity had ~547k net of deposit/withdrawal flows so we ended up with the graph on the right that more accurately showed it's PnL. That's the graph on the right: their hourly net trading P&L ÷ prior-hour equity.
We then reconstructed it's $BTC positions against $BTC price action
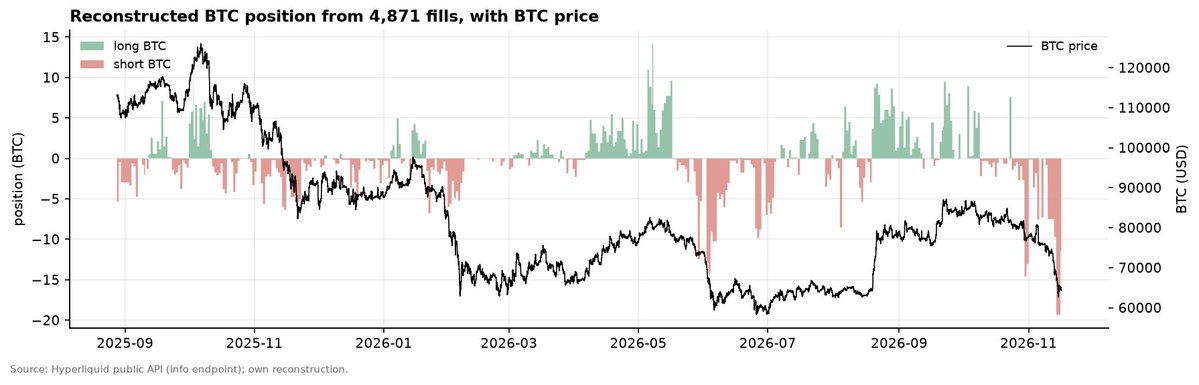
Hourly reconstructed position (sum of signed fills) against BTC
The rebuilt positions has a .985 correlation with the vault during the fit period, and a .997 correlation in the unseen period.
How does it trade?
Before trying to decompose signals, we looked for patterns that might give us a clue.
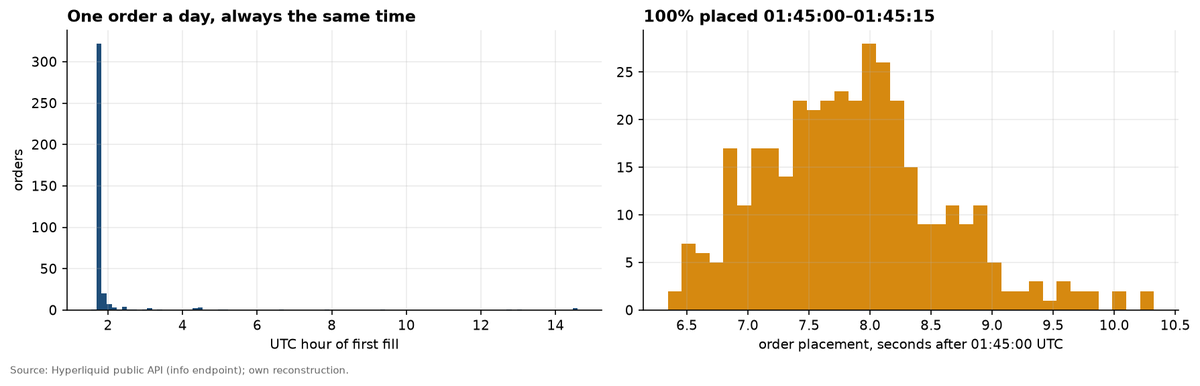
Left: time of day of each order's first fill. Right: placement timestamps from historicalOrders, which cluster at 01:45:06–10 UTC.
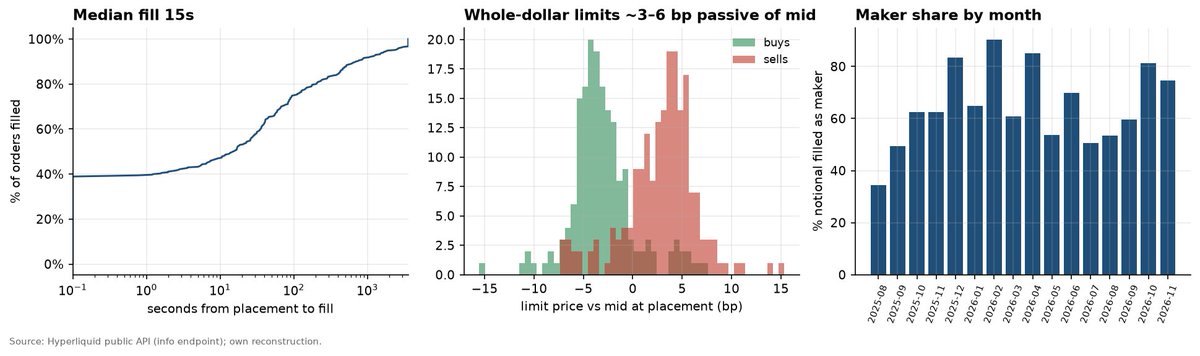
This gave us a clue indeed: One order a day, with about 370 order days. **Orders are placed between 01:45:00 and are limit orders a few bps passive compared to the mid-price. 65% of volume is maker **
The half we decoded
How we searched
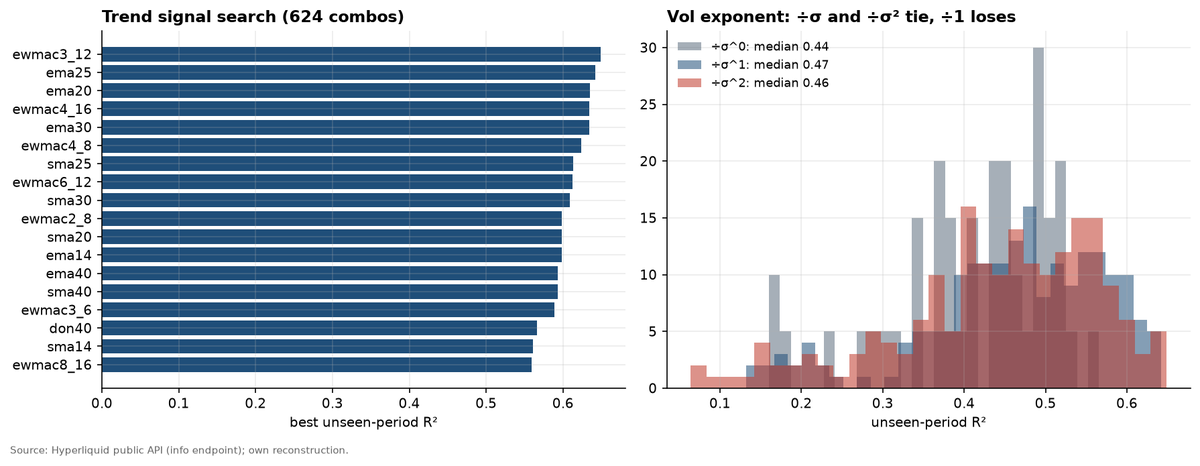
We didn't just guess a rule and tune it. Rather we tried to distill it every way we possibly could. To start, we tried different families to figure out what it was and then distilled once we figured out the families. We tried:
-
Trend Definitions: EMA crossovers, EWMAC pairs, price vs MA, Donchian breakouts, raw returns over 6h–100d, on hourly and daily bars. Basically over 600 combos of signals, volatility, and volume estimators
-
Sizing: vol estimators (realised, EWMA, Parkinson) over varying periods, exponents on vol and on trend strength left free, and nonparametric size maps
-
Dynamics: full rebalance vs partial adjustment, no-trade bands, signal-increment integration, pyramiding, hysteresis, state models, etc.
-
Two targets: matching positions (R^2), and daily PnL (correlation and tracking)
The rule
[未转换内容,参见原始 JSON]
In simple english, this basically just explains: "how strong is the trend", "how many people are trading the trend", and "how risky is it right now". The first line compares a 2d vs a 20d moving average, if fast is > slow, go long, if the opposite, go short. Then, it checks volume, if it's high, size up, if low. size down. Last, we check $BTC's variance over the past two weeks
[未转换内容,参见原始 JSON]
Plainly, the position is: trend x volume ÷ risk^2. This point to textbook kelly style sizing (diving by the square of volatility), so when $BTC is twice as volatile, position shrinks to 1/4 not 1/2. Lastly, this shows how the vault approaches the position, instead of going straight to the target size, the vault moves ~80% there, which helps smooth out the noise.
On data the fit never saw, this one rule explains about 70% of the vault's position, and 77% of it's daily trade direction.
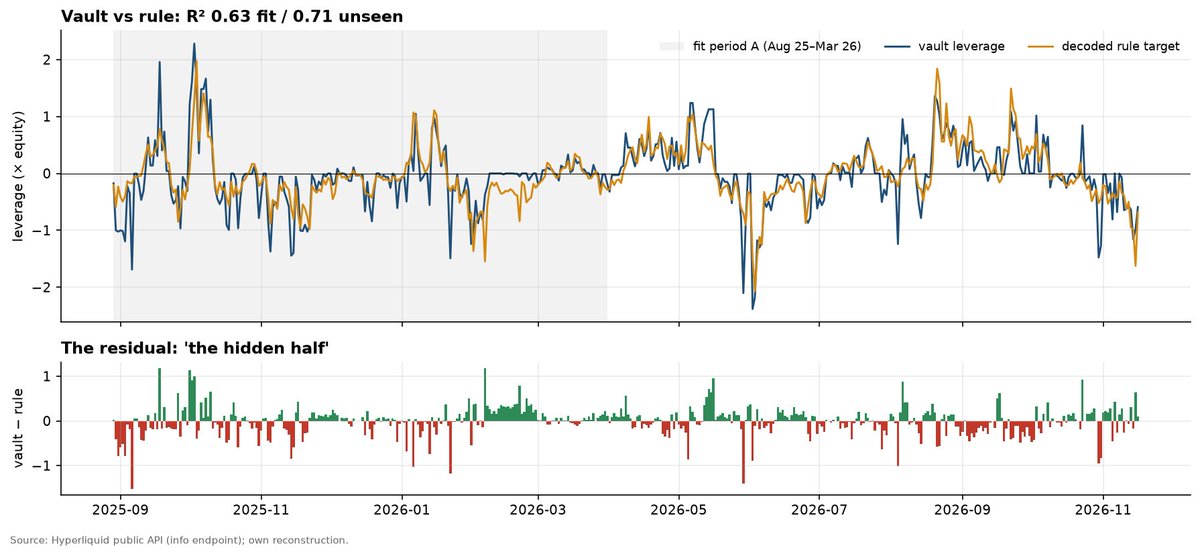
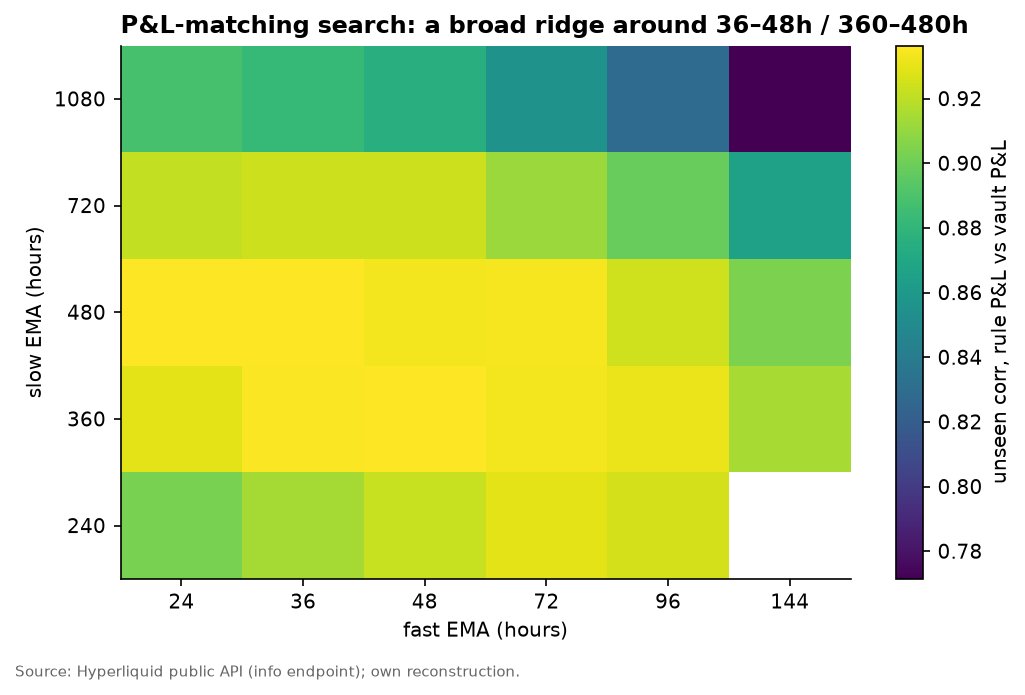
The unseen period fits just as well as the seen period, which is a good sign for the rule revealing a structure and not just overfitting. The parameters also add a bit of a more certainty because they sit on a plateau grid (36-48h fast ema, 360-480h slow, and 14d vol all fit pretty equally well).
Why do they divide by variance squared?
Someone who would be using a mean variance model picks the position w that maximises w·μ − (γ/2)·w²·σ², where μ is the expected return, σ² the variance and γ the risk aversion.
[未转换内容,参见原始 JSON]
We have already found that setting the expected return () proportional to trend x volume (μ ∝ s·v) gives the vault's formula pretty well (L* ∝ s·v / σ².). With γ = 1, this would be kelly sizing, and a (small) issue with this is that we can't tell if whoever made this made an optimizer or made this by hand because they only trade $BTC. Additionally, standard risk models usually scale out of risk when volume/crowding goes up, this model does the opposite and bets that trends with flows behind them will continue. Removing that is the single biggest loss of fit which points to it being a core part of their strategy.
Path dependance
The other day I asked a question when first looking at this vault:
I got resoundingly told no, and then told to look into path dependence for momentum. I had no idea what this was, but looking at the vault's sizing, it makes sense now. Path dependence means that it doesn't just matter where $BTC is or what it's done over the last n period, it matters how it got there.
For example, imagine $BTC goes up 15% in a month in two different ways. In path A it goes up in the first week and then chops sideways for the rest. In path B, it does nothing for 3 weeks and then rips in the last few days. In both cases it's gone up the same in the same period of time, the only difference is how it got there. A simple '20 day return signal' wouldn't explain how the move happened, it would just show the end result.
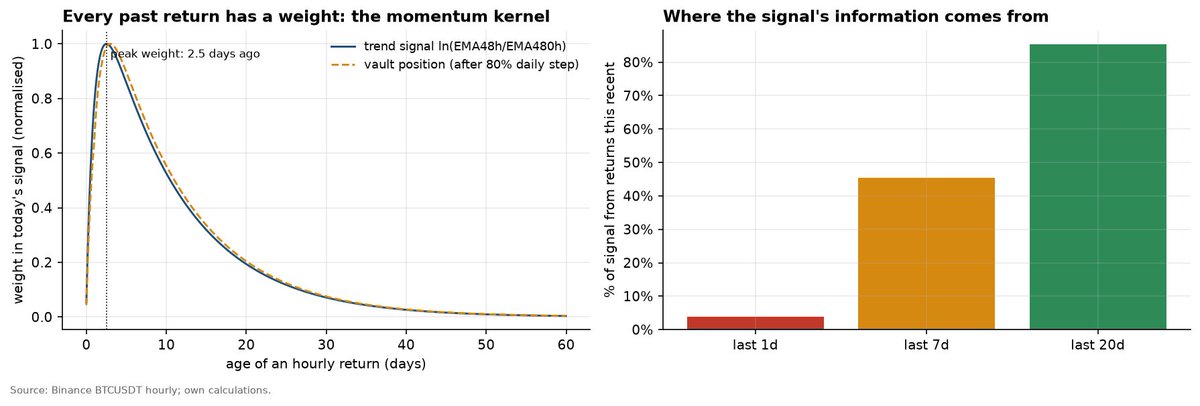
This rule doesn't, instead, it puts most of the weight on price changes in the last few days, so the second scenario would end up with 3x the position of the first.
[未转换内容,参见原始 JSON]
Because an EMA crossover is a weighted sum of every past return, the vault's position is based on the whole path and not just a vanilla return over a lookback. Only 4% of the signal comes from the last day, 45% comes from the last week and 85% from the last 20 days.
Additionally, the rule divides by volatility squared, so if the trend move is choppy, it will receive a smaller position signal than a smooth one. Lastly, the vault only moves ~80% to the target each day so that way it still retains a bit of the previous position.
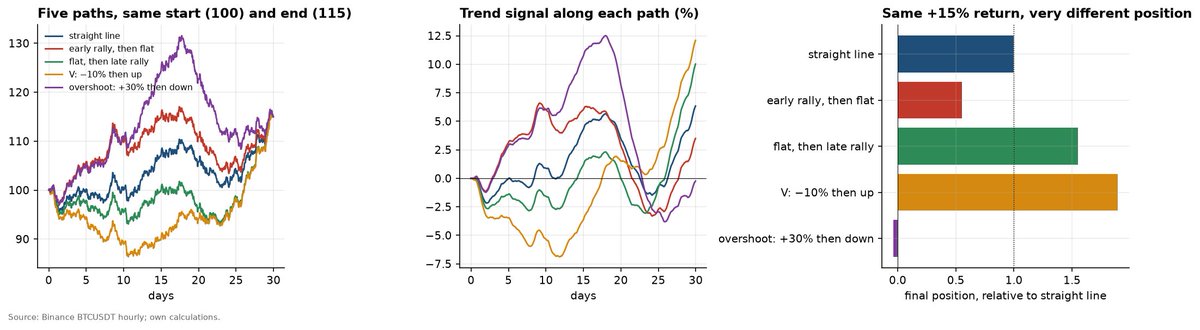
Twice the variance gives 1/4 of the size.
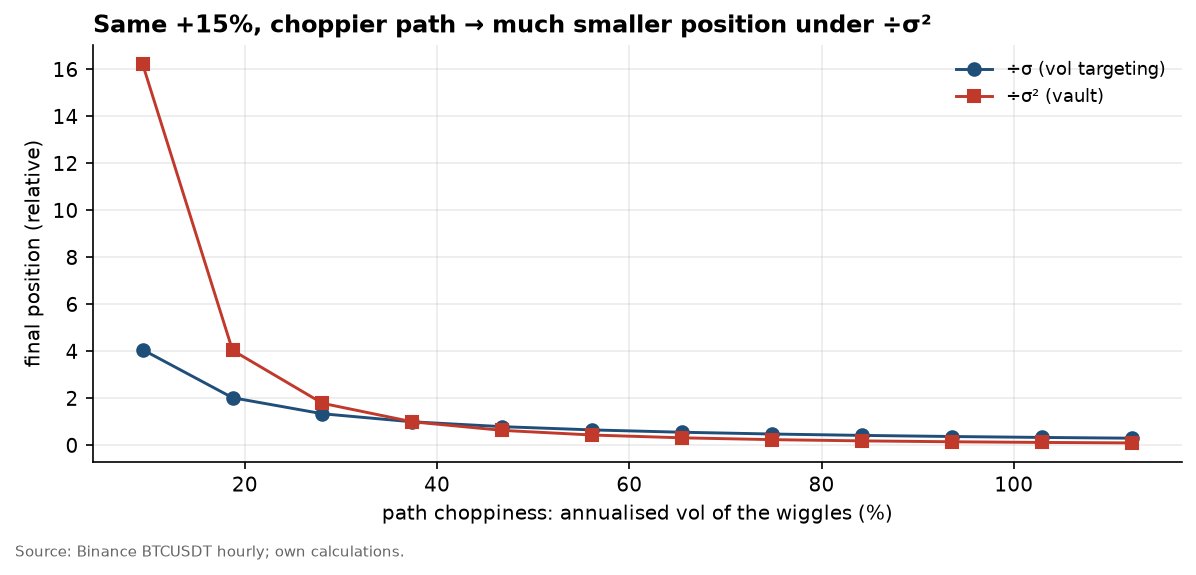
So very simply: short, fast moves get big bets. slow, choppy, moves don't.
Does the rule make as much money as the vault does?
The rule's daily PnL correlates to the vault's at roughly 0.83, but makes half the money. However, this mainly due to one specific stretch of time in February when something happened (and we could not figure out what). Stay tuned though because our reworked signals is just as good as the vault's.
The fairer test of a decoded strategy is how well it does on the data it wasn't fitted on and never saw. To that regard, it did pretty well (it gets 95% of the vault's sharpe)!
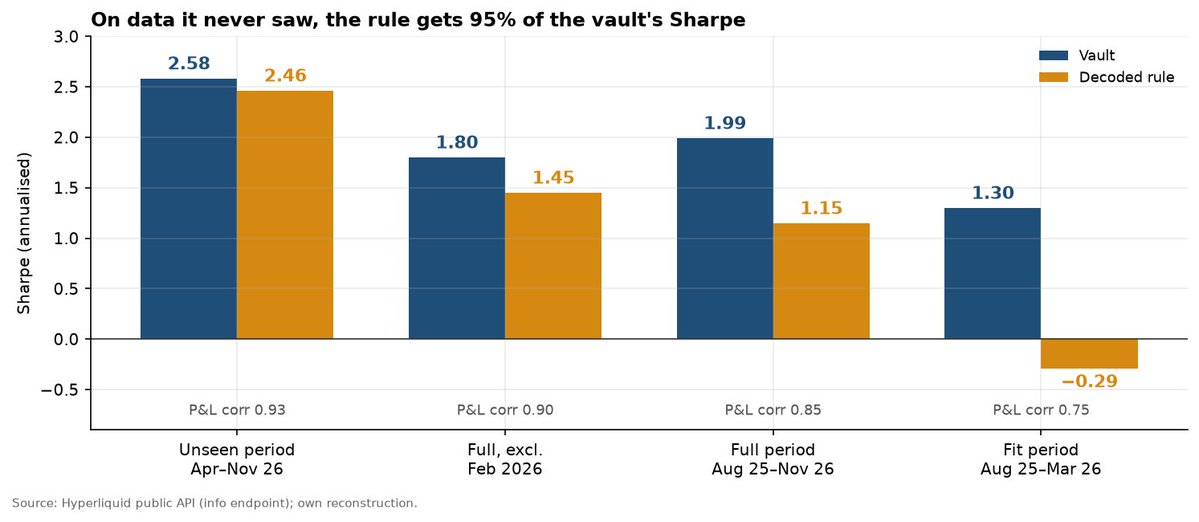
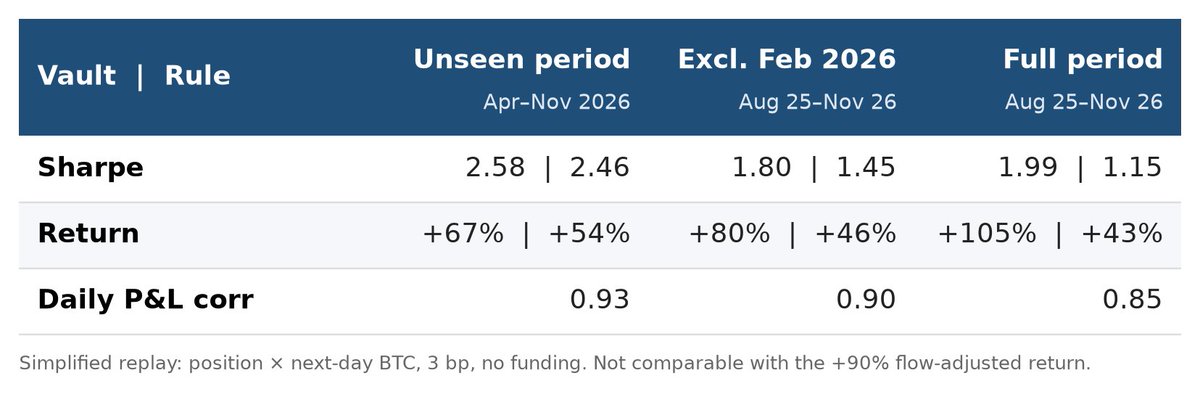
The gap is mainly within the fit period + mostly in a single month. The full period totals exaggerate this because a bad month leads to less compounding, and I didn't want to flatter our result without showing you everything we found (good *and* bad)
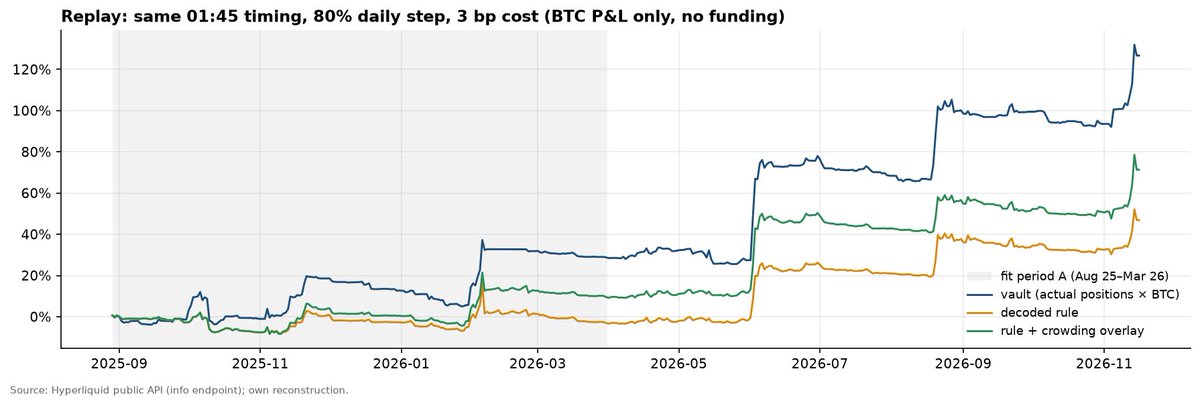
Simplified replays: position × next-day BTC return
Here's what we couldn't decode
So whatever our rule doesn't explain is the residual. And because the PnL is just position x returns, we were able to split the vault's PnL in two.
[未转换内容,参见原始 JSON]
Here, the first period is what we found, the second is what we couldn't.
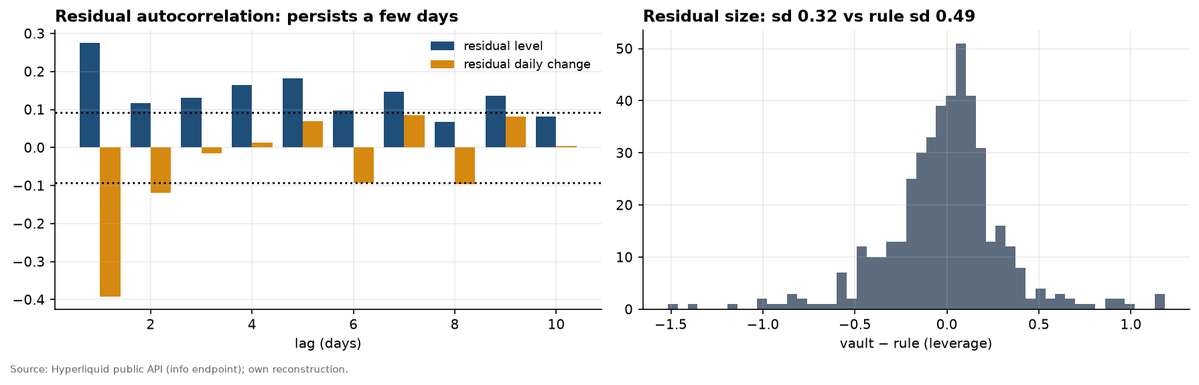
The residual is pretty large, persists for a few days, and can weakly predict the next day's $BTC return.
Where is the gap?
Splitting by month, we answer this pretty quickly.
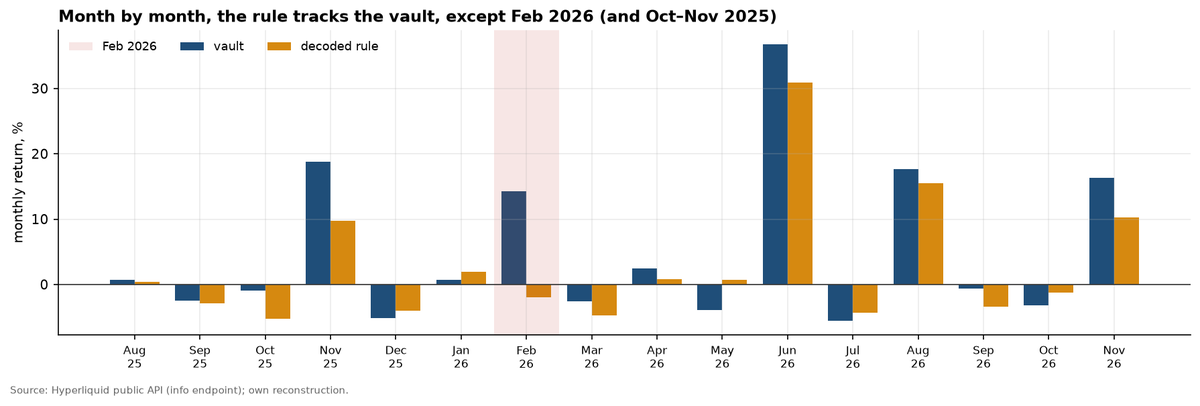
In Feb, the vault made 14% while our rule lost 2%. That one month is the biggest gap. The rest of the months are +- 5%.
In Feb 2026, the vault went flat for 13 days during a $BTC crash, and made 14% while our rule lost 2%. We tried to find the missing rule, and here's what we stumbled on.
[未转换内容,参见原始 JSON]
We wanted to test if it was a simple on/off switch. If we undo the 80% step, it shows us the size the vault was aiming for.
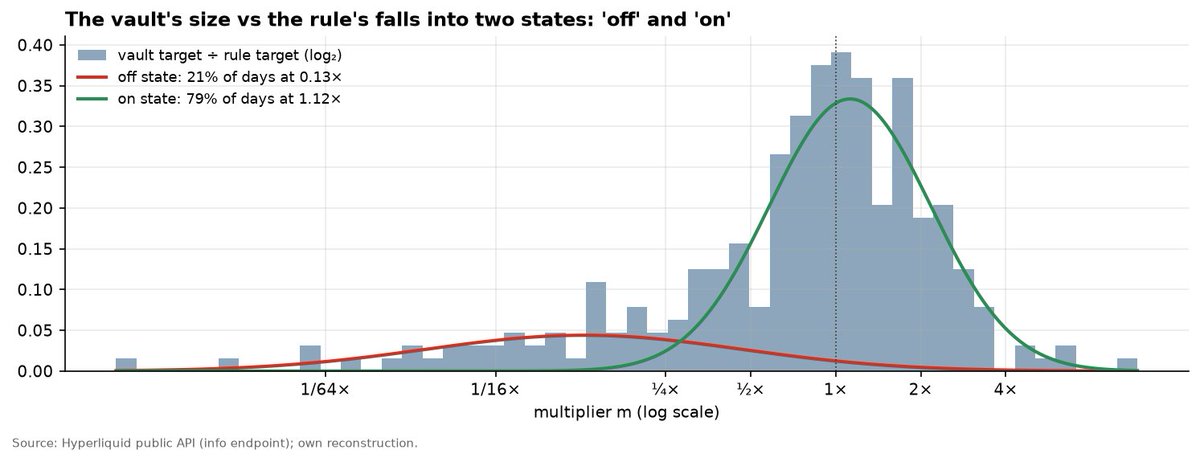
So here you can see how the multiplies isn't smooth. Rather, it looks like two states (fitting our on/off example).
[未转换内容,参见原始 JSON]
[未转换内容,参见原始 JSON]
Basically what this means is that the vault runs the rule on full size 4 out of 5 days. About 1 day in 5 it runs the rule at 1/8. "Off" spells are pretty short, roughly a 39% chance of being 'off' after an 'off' day, and 24% after an 'on' day. Day to day autocorr is .13 so the rule is being updated daily, not a regime.
We tested a ton of models (state machines, hidden markov models, etc) fitted on all the data we had on $BTC and that barely moved the answer. This remains unsolved.
[未转换内容,参见原始 JSON]
Even thought we can't copy what they did in Feb, we can somewhat approximate it using funding rates (overfit risk). We trained a size multiplier on the top coins from 2022 (post-FTX) to 2025 and when we distilled the model we could see what features it liked the most. It's first split was BTC funding. The absolute simplest version we found was a switch that basically says: *if shorts were paying longs, turn off the rule. otherwise continue on as business *
To clarify, this isn't what they used, but we did try to approximate it using this and it seemed to have held up even pre-FTX blowup. Use at your own risk!
Now here's what you've been waiting for.
How to trade this and make some money
First, we applied the rule unchanged since we found it on $BTC to Binance perps (625 symbols, incl delisted) from 2020 to 2026. Nothing was fitted on any time period so this is pretty much out of sample.
We ended up with two sleeves:
-
The BTC rule on daily bars
-
Cross sectional (long the best short the bottom)
We used the same score to rank coins against eachother, then you long the top and short the bottom.
[未转换内容,参见原始 JSON]
To avoid singular lucky settings, we averaged this over 3 different trend speeds, 2 volume windows, and then the top 5/10/15/20/30 coins.
The two sleeves are correlated at 0.05, so combining them helps a good chunk.
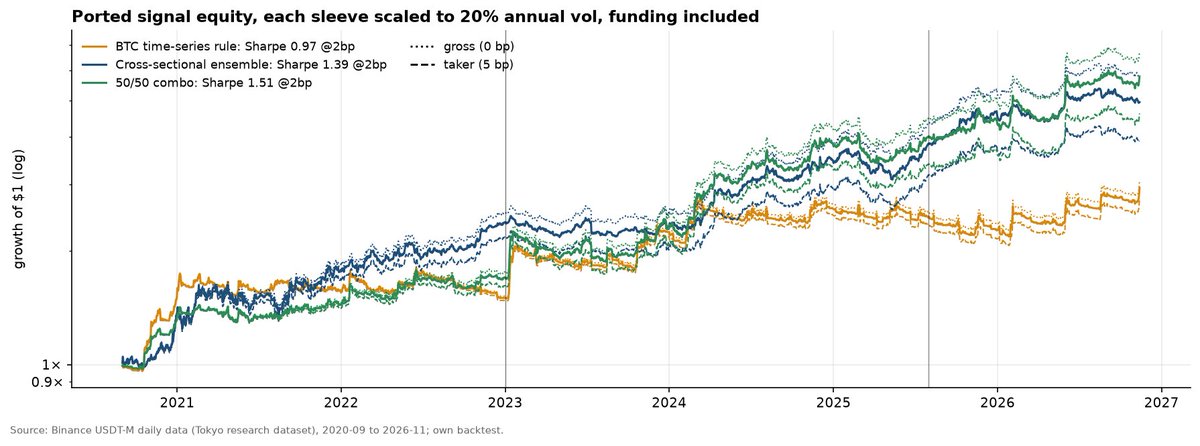
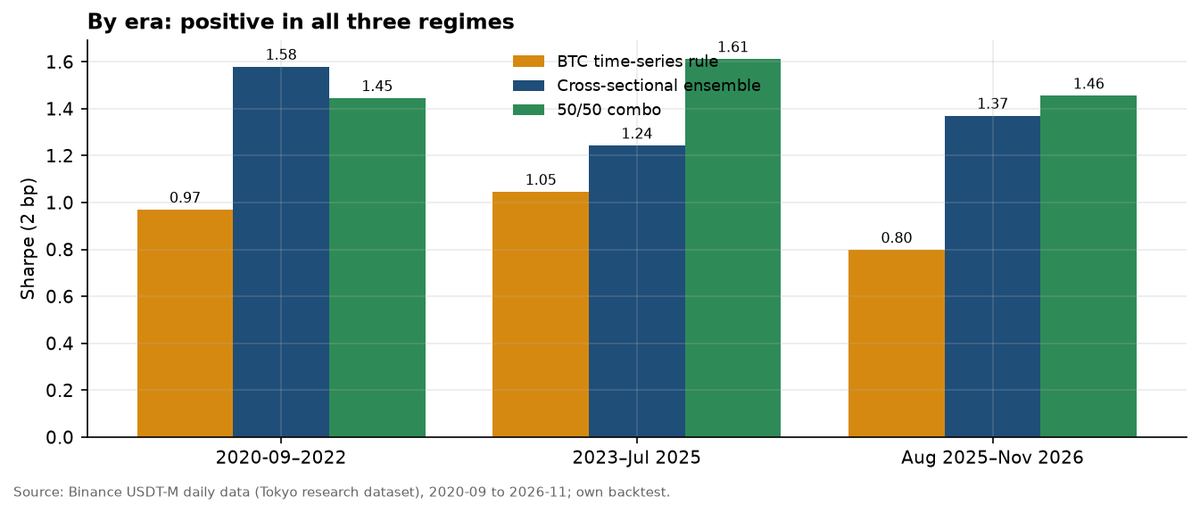
Our combo is positive in all three eras, with Sharpes of 1.45, 1.61, and 1.46.
Brief bit on robustness.
Every vault ingredient adds something and you should test and look at this yourself. Not just blindly follow a formula from a pseudonymous wassie on the internet. Ranking on trend gives a Sharpe of 0.90 at 2 bps. Dividing by σ lifts it to 1.35, and the full vault score (trend × volume ÷ σ²) reaches 1.56
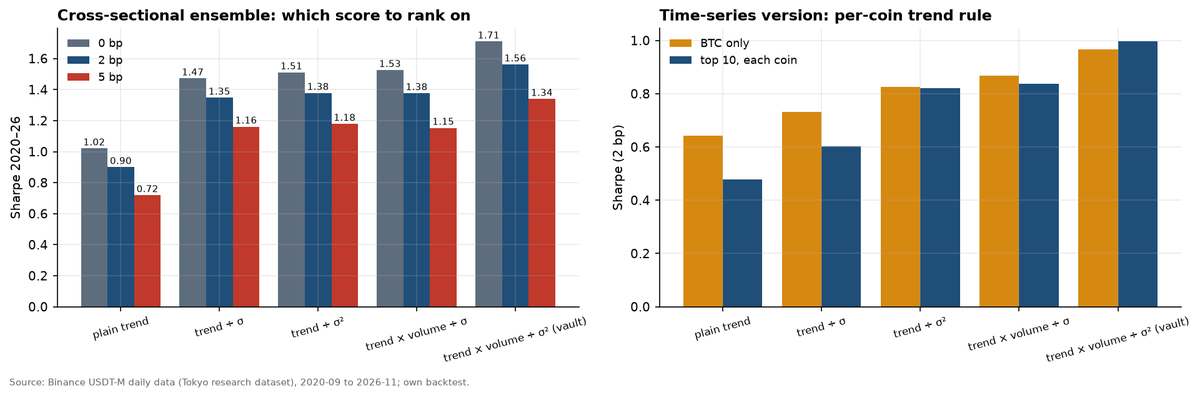
Parameters are a plateau not a peak, and modifying any of them barely moves the Sharpe (±0.15). The only sensitive setting in the vol exponent which is what we use for sizing/variance.
Don't just pick one universe, try all of them! Surely you're going to see a 'best' and a 'worst' but this is how you overfit and it's likely better to diversify.
Turnover is high but break even is 60 bps each way. That's pretty good. No trade bands cut turnover but didn't help returns/Sharpe.
Hope you guys enjoyed this, I had a lot of fun writing it!