I reverse engineered a 1.9 Sharpe Hyperliquid vault. Here's how it works, and how to trade it
文章目录
部分视频或图片暂未收录,已在正文保留提示;需要时可查看原文。查看原文 ↗
I was browsing X the other day and saw an active Hyperliquid vault that had a headline 3 month rolling Sharpe of 5.7, I was dumbfounded. So I decided to try to reverse engineer, then systemize it. I said I'd democratize the info, so here's what this will cover:
-
The vault's strategy (what I found, how I found it, what I didn't find, why might this pay)
-
Turning it into a system (does it still hold up (yes), is it overfit (we tried our best to limit it), how do I know that (you'll see), and how can you trade it without blowing up)
How the vault works
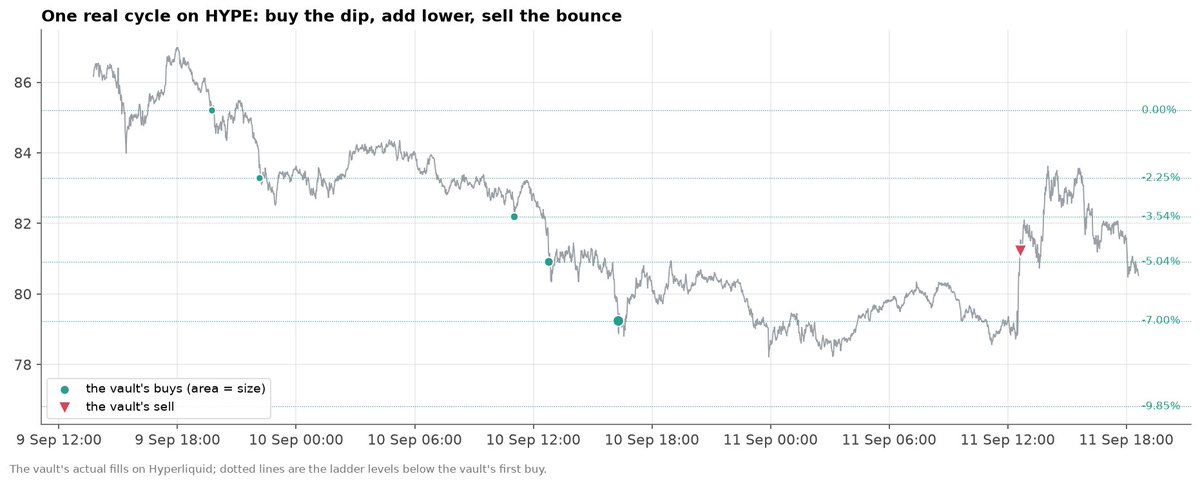
An example cycle pulled from the vault's orders
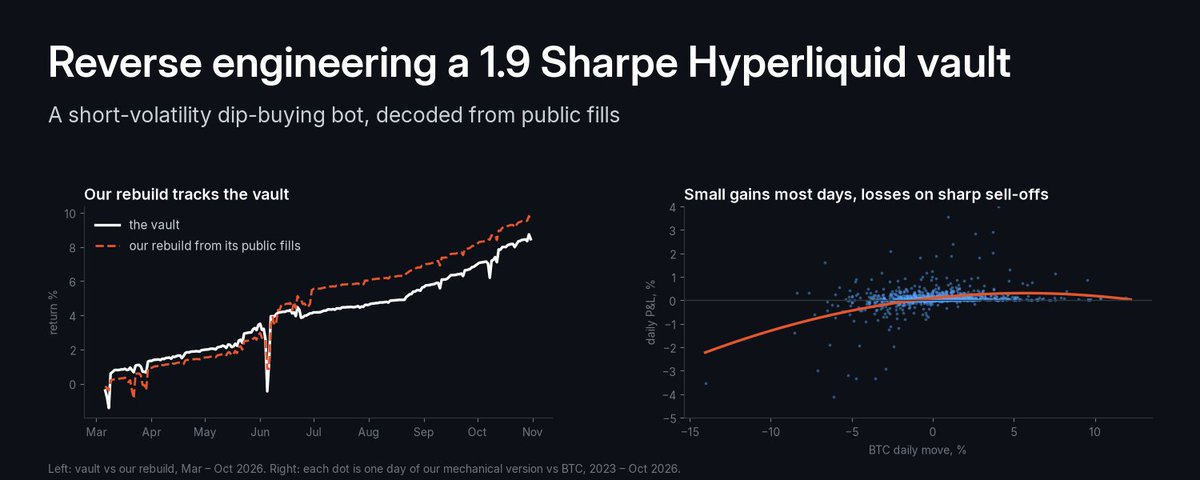
The vault has an almost perfect PnL, straight up and to the right with only a very little blip in the middle. Since Hyperliquid trade data is public, we could pull all of it's orders to take a look to try to see what it was doing.
Pretty quickly, it was obvious that this was an algorithm that is basically just short volatility. Each order ID carried a tag depending on what part of it's strategy was placing it: first buy, ladder add, take profit, and trim. Grouping it's fills by tags turned 11,000 fills into a handful of rules.
Here you can see one of it's cycles, the price drops and the vault bids right under the price (0.14%), if it keeps falling, it just buys more at predetermined sizing and levels. When it bounces, it sells everything at once for a small profit.
It's rules
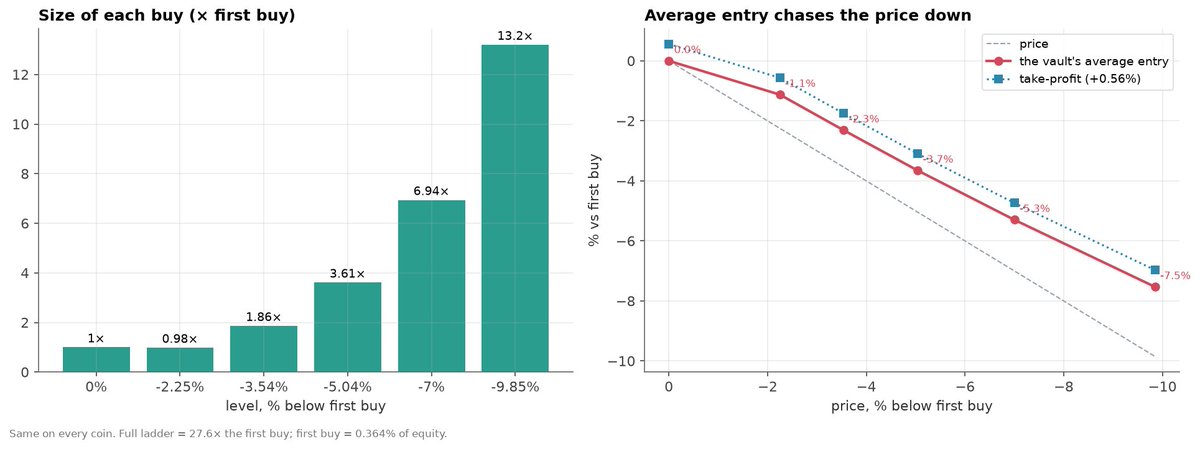
Data that helped us figure out it's sizing rules
The bot has a few rules that were pretty evident once the data was collected.
First, here's what we couldn't find:
-
Universe selection. We couldn't reverse engineer their coin selection, and it changed at various points of time, most noticeably after the June crash.
-
Exact entry/exit rules. We decided to not hyper-optimize and so we tested a broad combination of moving averages and drawdowns and found that it was fairly stable.
The Ladder:
-
Position adds sit at −2.25%, −3.54%, −5.04%, −7% and −9.85% below the first fill
-
Size is set to 0.98, 1.86, 3.61, 6.94 and 13.2× the first buy. This doesn't change based on the asset (eg BTC and Doge would have the same fixed sizing)
-
Because each additional add doubles the position size, the average entry aggressively chases the price down. At -7%, the average entry is -5.3% so a bounce of ~2.5% gets the whole position in profit.
The entry/exit:
-
What we roughly found: price ≥0.6% under its 15-hour EMA and ≥0.85% under its 10-hour high. This is our least certain rule because we couldn't replicate all of it, and you'll see how we adjusted for that in our implementation. Additionally, we wanted to be very careful to try not to overfit because it's entirely possible to find the wrong patterns on any data.
-
The vault sells almost everything at +0.56% over the average entry, which rises to +0.65% when the ladder is deep. 93% of the vault's sell orders close the whole position
Sizing/Leverage
-
The first buy is 0.364% of equity. This stays true for every coin. When we say equity, we mean their total account balance, not incl unrealized loss. Open losses don't shrink the size.
-
Leverage is almost entirely flat, and peaked at 0.95x.
How accurate is our reproduction?
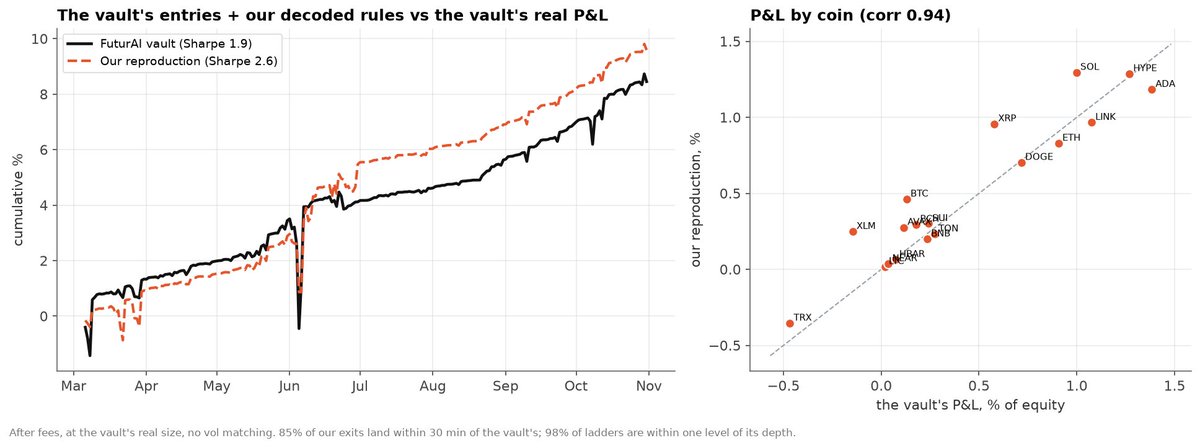
How close are we to theirs?
We tried to compare the rules we found against the vault's and got this:
-
85% of our exits land within 30 minutes of the vault's;
-
98% of ladders end within one level of the vault's depth;
-
P&L by coin correlates 0.94.
The June gap
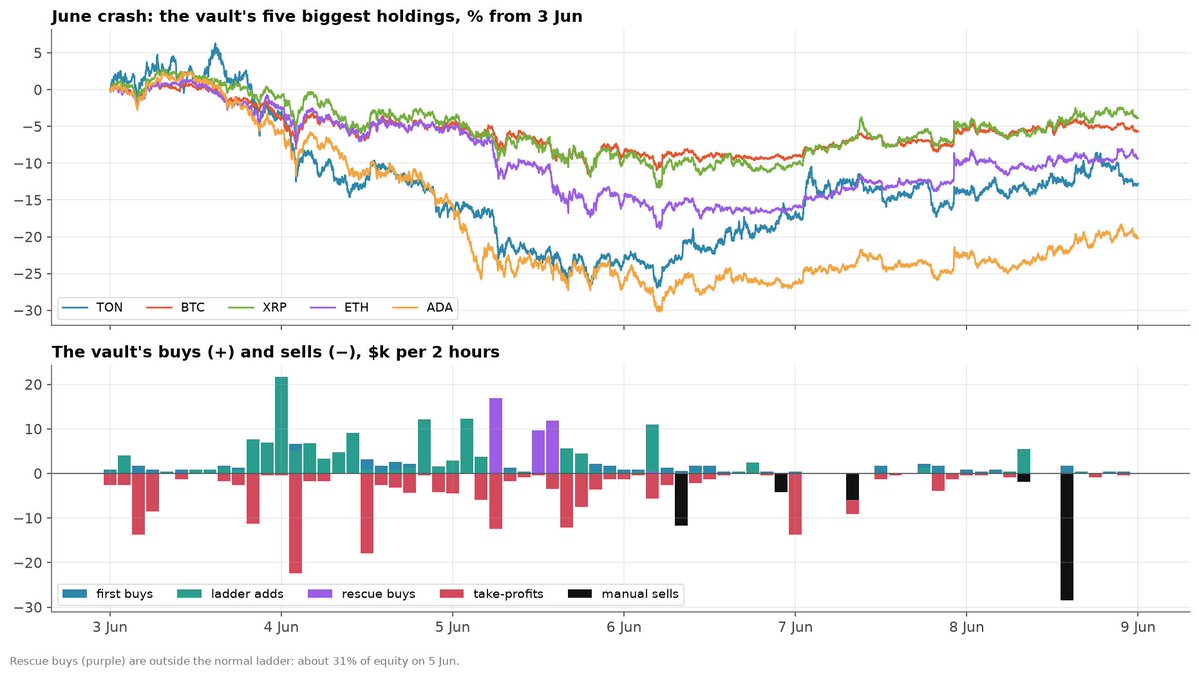
Crash data
During the worst period for this strategy, June, the vault manager made manual rule changes.
These include:
-
Rescue buys on the ladder which amounted to 31% of the vaults equity
-
Manual cuts of stuck positions
-
A week after at reduced size
-
A month after of only trading the top 5 coins by market cap.
You'll see how we decided to account for this when we tried to systemize it. Funny enough, had they stuck to systematic rules, that period would've gotten a Sharpe of 2.6 (+9.6%, −2.0% max drawdown), vs the vault's 1.9. Every month was positive for both regardless.
Why it pays, and why it's shrinking
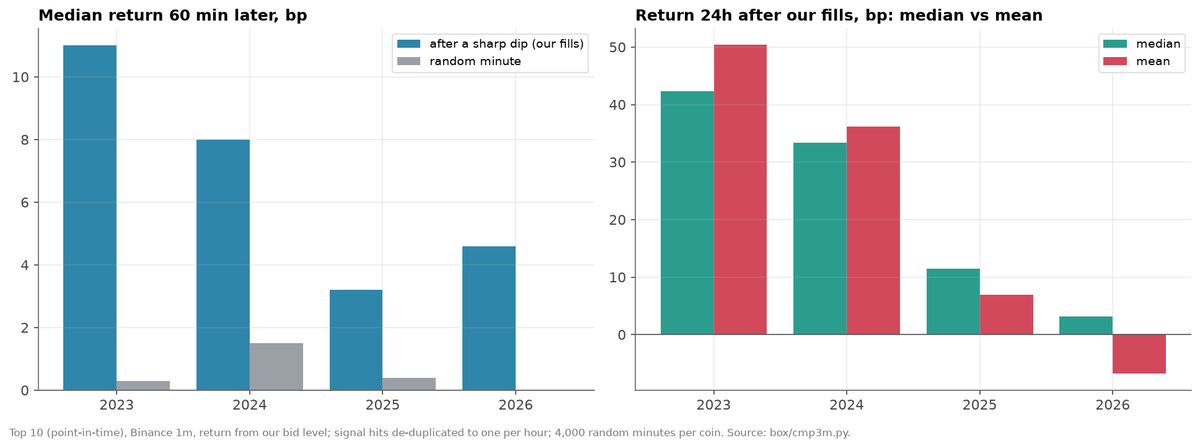
Risk premia, visualized
Now that we know what it is, and how it works, why does this pay?
Sharp dips in large coins can be because of a lot of things, but they are usually forced due to liquidations, stops, and price insensitive market orders which can cause price overshoots that reverse back. You get paid for absorbing that premia and providing liquidity, but you will get hit during drawdowns, and more so when the price keeps dropping.
In 2023, the median return an hour after was +11.3 bps, versus +0.3 bps for a randomly sampled minute. You'll notice that the mean is lower than the median, that's because sometimes when there's a dip, it just keeps dipping. The strategy is effectively selling crash premium, which carries a premium due to the cascading nature of crypto perpetuals.
However, this premium is shrinking as more people discover and take advantage of this. In 2025-26, the median bounce had lowered to +3-5bp. It stands to reason that this trend will continue until it's arbitraged away.
Additionally, this strategy does modestly during uptrends, and will miss most of the trend. We attempt to smooth this property at the end.
Now, time to show you how you can trade it yourself!
Making it a system
Now that we know roughly why this exists, we wanted to turn it into a system. We kept the simplest rules we could: top 10 coins by market cap (ranked on the previous day, so no lookahead), the vault's ladder and take-profit, and one loss rule. Then we ran it on Binance 1-minute data from 2023. We tried not to overfit. Instead of optimizing for the best setting, we ran broad sweeps to make sure no single parameter was a magic bullet, and looked for parameters with flat results across a grid. Here are some of these tests.
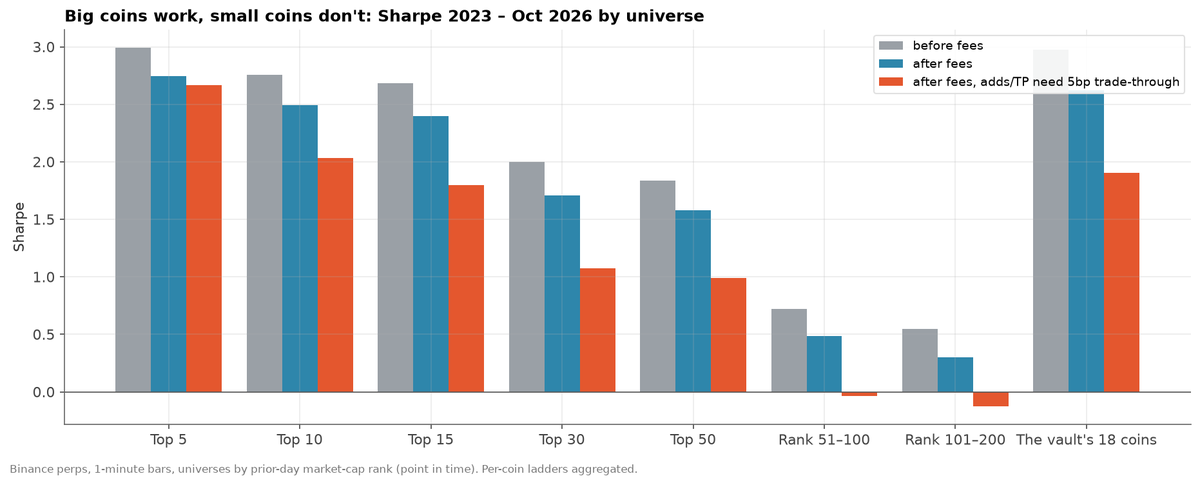
The first question was which coins do we include in our universe. So we segmented the universe (incl. delisted coins) to see if there's a relationship between this effect and size. There is. The bigger the coin, the better it works: top 5 gets a Sharpe of 2.75 after fees, top 10 2.49, top 30 1.71, and ranks 51–100 just 0.48.
That also fits our hypothesis for the effect of this being risk premia. Because in big coins, a sharp dip is usually forced selling that deeper order books can absorb, so the price mean reverts on a low enough timeframe. In small coins, a dip is more likely strucutral, so it keeps dipping.
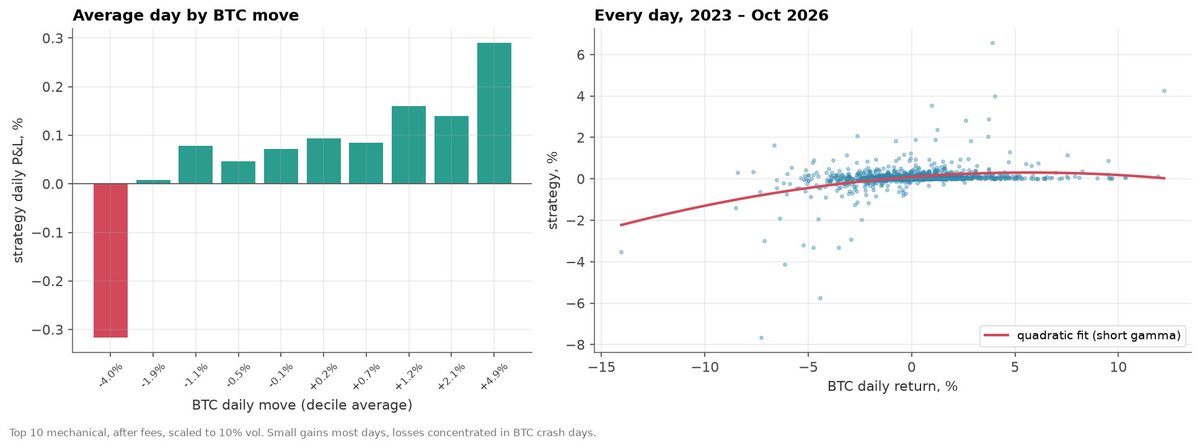
Next, we sorted every day from 2023 to October 2026 by how much $BTC moved, and compared it against the strategy returns. The pattern is what you'd expect from selling insurance and collecting a premium, its extremely skewed.
In 9 out of 10 buckets the strategy makes a little money, but all the losses sit in the worst 10% of BTC days, and on average only days when BTC falls more than about 2.5% lose money.
On the right, every day is a dot and the axes are BTC's daily return on the X axis, and strategy return on the Y axis. The curve bends to the left: in normal markets, it makes small steady gains. When the market crashes, it crashes too. In options terms, that's being short gamma, like selling puts.
Our loss rule
The obvious next step is trying to figure out how we can limit crash days without overfitting. To accomplish this, we tried to use the simplest tools we could think of. If you think a stop loss would help, you would be mistaken.
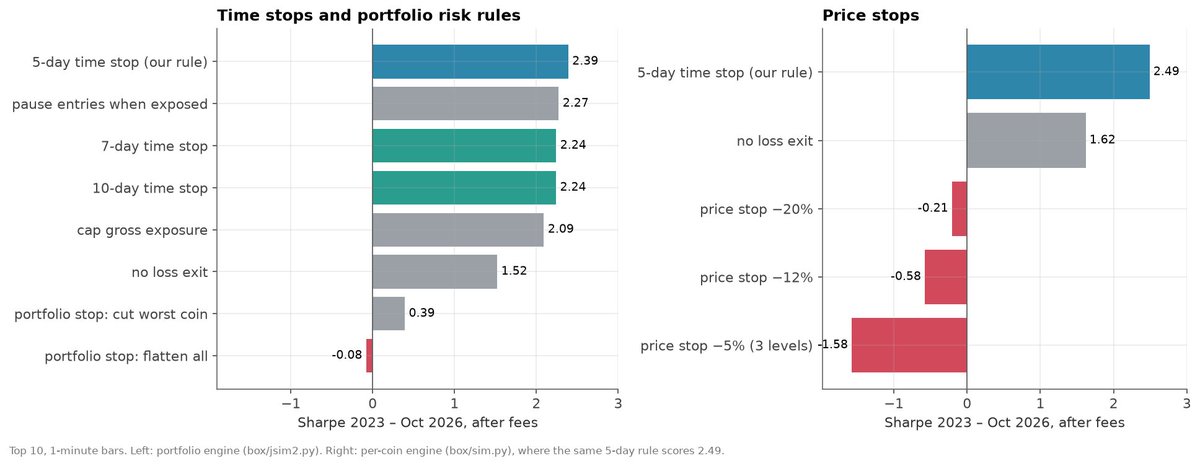
Adding price stops at various levels is deeply negative, and it intuitively makes sense why. You're attempting to close the position right when it's time to provide the liquidity you get paid for the rest of the time. All stops have negative Sharpe, worse than having no stop which has a 1.62 Sharpe.
Next, one might try to be fancy and think 'well what if I cap my portfolio exposure by adding portfolio based stops and exposure caps'. Good luck trying to outsmart the market and maybe someone smarter than me can figure out how to do that. The way I see it, you were very happily collecting the premium, now you're going to have to pay out.
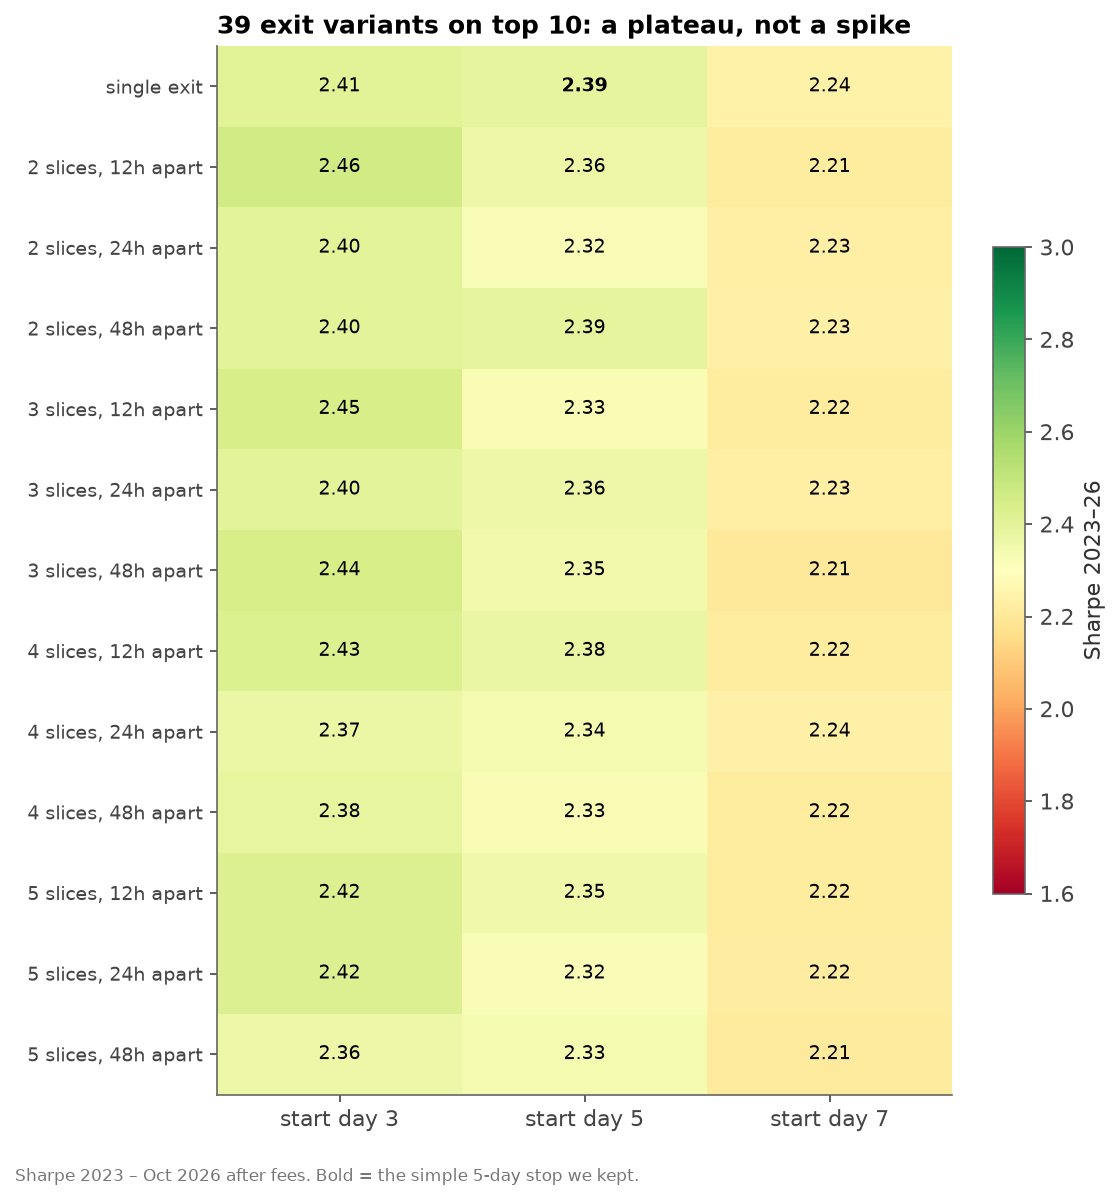
What does work however is a time stop. Close any open ladder after 5 days, irrespective of price. The bounce usually happens within a few hours, so if it hasn't in 5 days, it probably won't. This happens rarely, roughly 10x/yr, but lifts Sharpe from 1.6 to 2.4. To be clear though, this is not a rule from the vault, this is our attempt to systematize the manual cuts they made during the crash. Here is a parameter grid of exit timing, you can see that it is relatively robust (and hopefully not overfit). Additional overfitting and robustness checks are at the end for anyone curious
Results
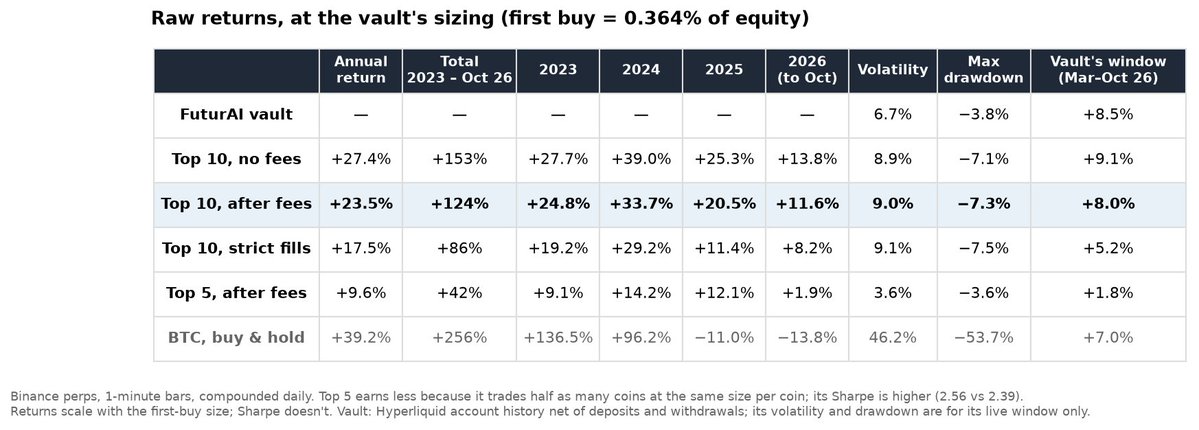
Raw returns
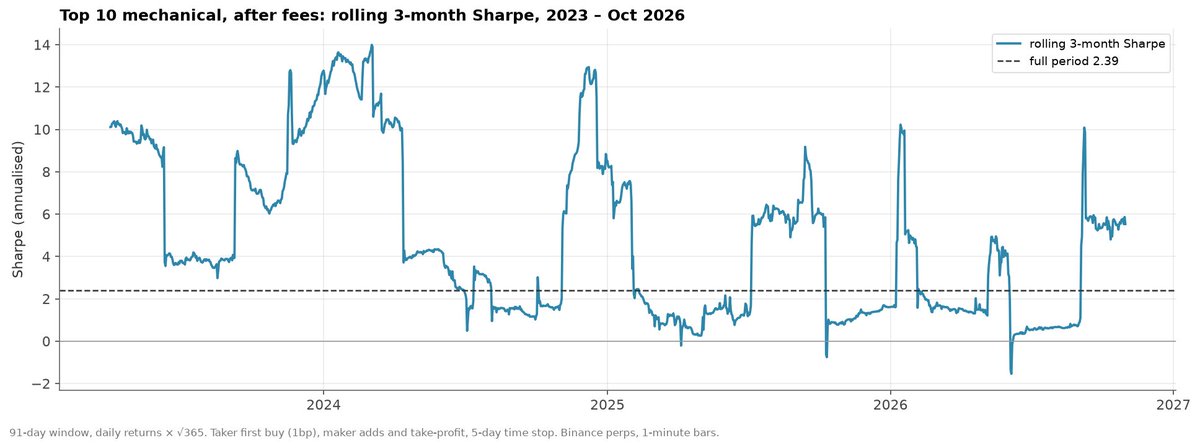
With a universe of the top 10 coins from 2023 to October 2026 and using our systematic interpretation of the vault's strategy, we get a Sharpe of 2.39 after fees, with a** −7.3% max drawdown** at the vault's sizing. The vault's is higher because we could not identify their exact mechanism of picking coins, and also because we decided to go with the simplest thing of just the top 10 coins. By year the Sharpe goes 7.4, 3.9, 1.5, 1.4, which is what we alluded to earlier about the premia collapsing.
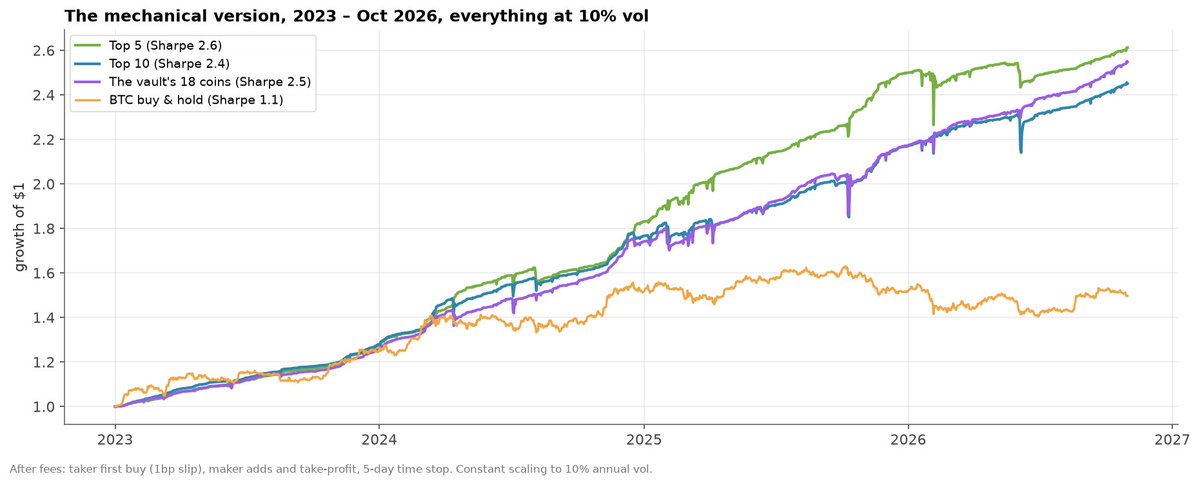
You may notice that the vault's chart looks a bit better than ours, will less of a drawdown. That seems to mainly be due to the manual changes made during the June crash. In fact, if purely mechanical, it might've done a lot better.
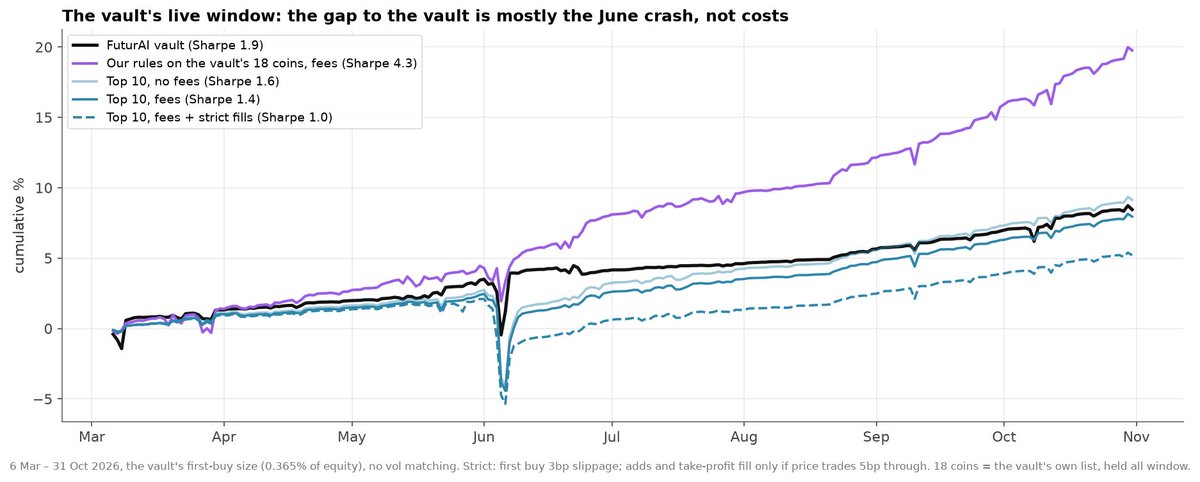
Over the vault's live window, our mechanical strategy using the top 10 gets us a Sharpe of 1.42 after fees (1.03 strict), against the vault's 1.88.
The majority of it is June performance. Excluding June, ours is 4.8 against the vault's 3.3. Our mechanical time based exit fired on BTC and BNB a day before the bounce, so we sold near the bottom while the vault manager bought the bottom with a large % of their equity.
If we run our rules on the vault's 18 coins, we end up with a 4.3 Sharpe. A lot of that is obviously hindsight, since we only know what they traded after the fact (before people inevitably yell at me about overfitting), but over 2023–26 those 18 coins have a Sharpe of 2.49, so roughly the same as our top 10.
Does this survive costs?
We modelled the first buy as a taker order (which always fills, 1.5bp slippage, 4.3 bps fee). Ladder adds and take-profit we modeled as resting maker orders because for the adds they are contingent on price dropping below a level so maker is actually better for us. Exits are not price sensitive, but if our price isn't traded through in ~1h, we exit as a taker.
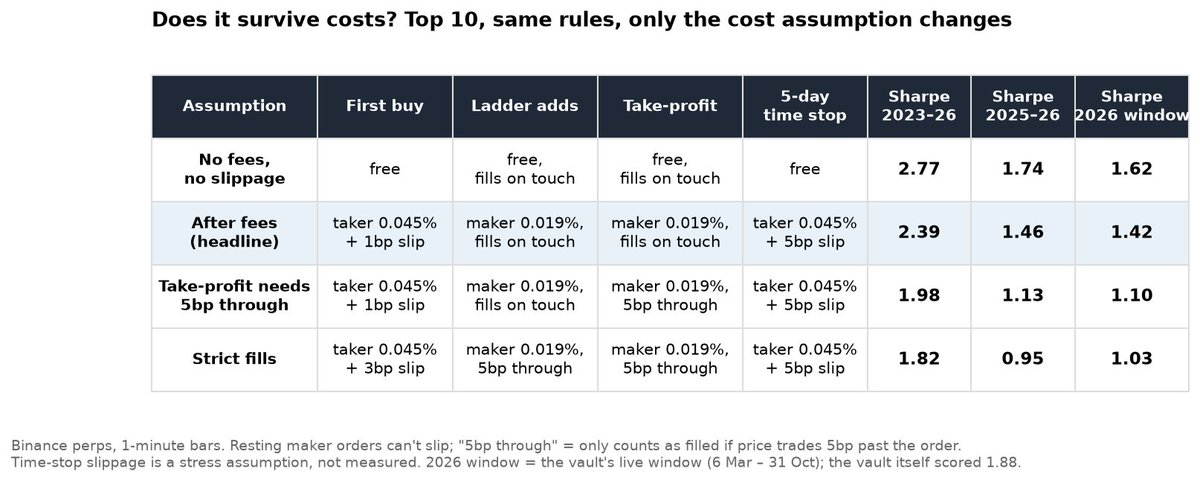
Cost assumptions
We also stress tested under different fill assumptions, some pretty conservative.
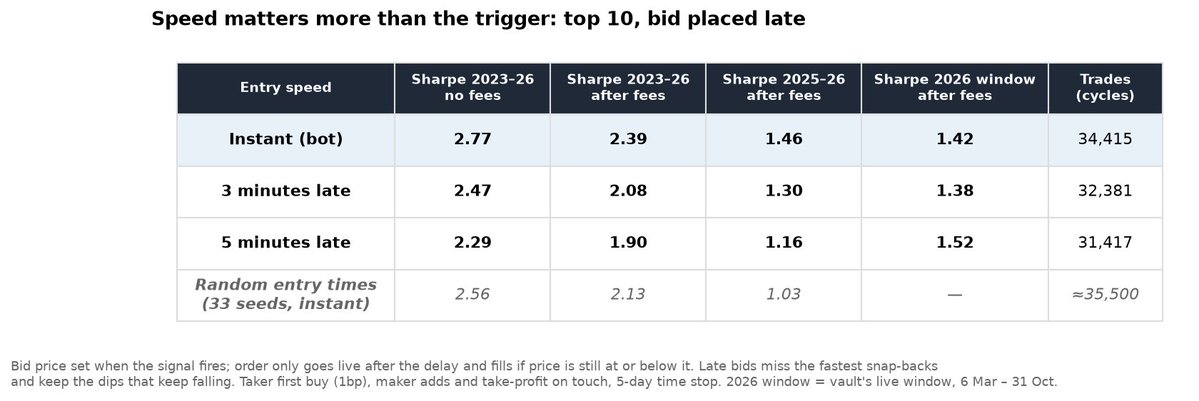
Additionally to cost, entry speed matters too. Entering 3 minutes late takes Sharpe from 2.39 to 2.08, and 5 minutes late takes it to 1.90. This makes sense because you're trying to absorb forced selling so it is latency sensitive. However, in trading terms, 3 minutes is a LONG time.
Is this just overfit?
You can decide for yourself. Here's how we tried to break it:
-
Exit: we tested 39 variants (time stops of 3, 5, 7 days, selling variants of slices over 12-24h). **All of these landed between 2.21 and 2.46 Sharpe, **we kept the simplest rule.
-
Entry: changing the entry condition gives between a 2.09 and 3.25 Sharpe. Our reverse engineered rule sits on the median of that distribution, not on a tail. Even if we enter on random minutes with the same ladder strategy, we average 2.13 across the 33 different seeds we tried. The trigger helps, but most of the strategy is in the ladder and exit rules.
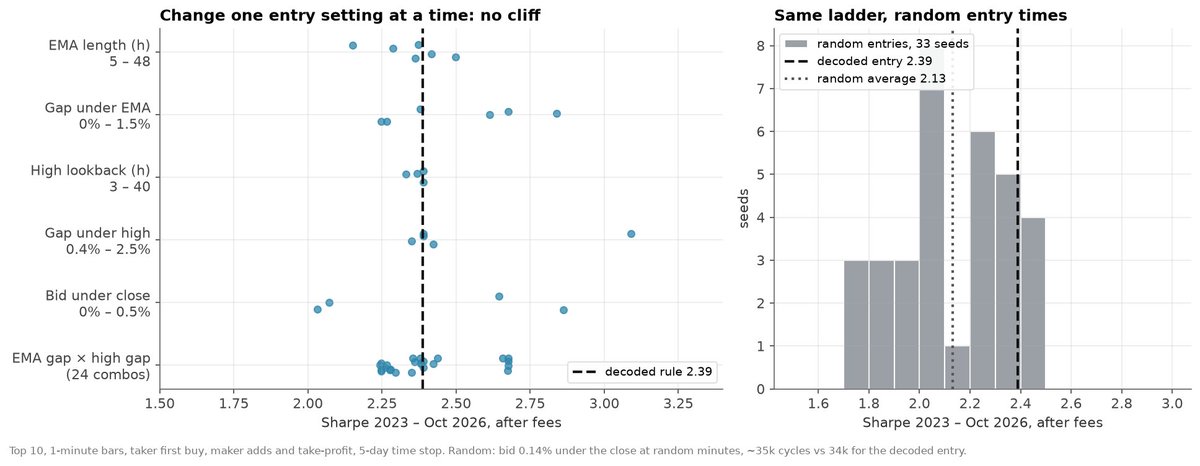
Entry settings test
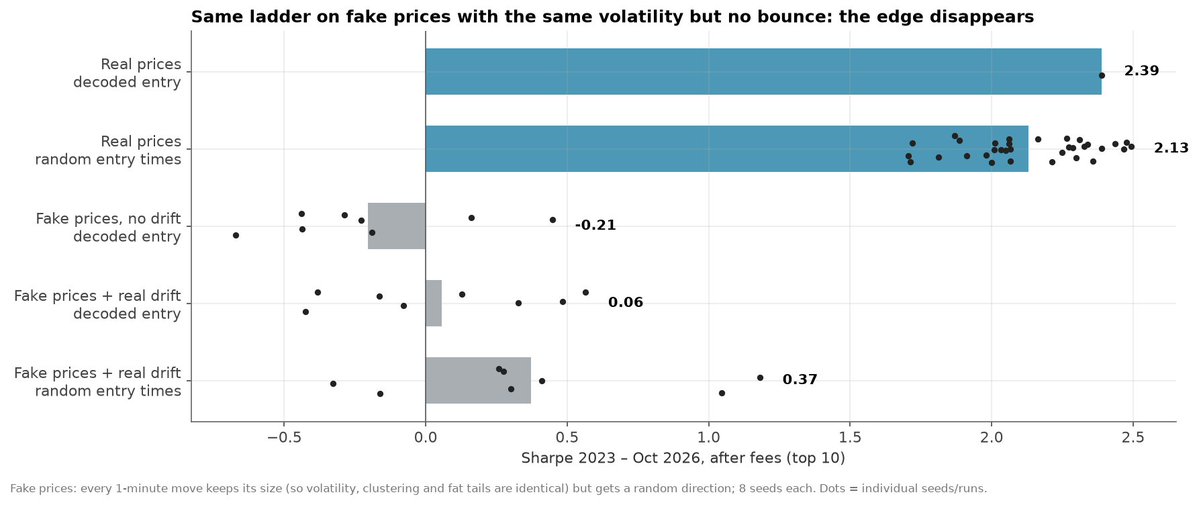
- Is it just a martingale that hasn't blown up yet? That's the natural question for this. We tried to test that by running a ladder on fake prices. We took every 1 minute move and kept the size but we randomized the direction. The clustering and volatility was roughly the same between the real and fake data, but the bounce effect was entirely gone. With the fake prices, the top 10 averages -0.2 Sharpe after fees, and 0.06 with the drift from the real data added back. We tried this 16 times, and not once did it get a Sharpe >0.6.
Fake price test
This implies that the edge is an inherent effect of the market and not just an artifact. If it was an artifact, it would've shown up in the random walk, but the data suggests it's real due to how it doesn't work on small coins, and how it doesn't work on random data.
Can this be smoothed?
Since this is a strategy that does not use very much of your capital. The last thing we wanted to test was whether or not running this in conjunction with another strategy that may be complimentary would help.
All of these are unoptimized simple rules (there's probably something that works really well with this that someone smarter than me can share but for the sake of keeping it simple, we didn't probe this too much)
-
Long BTC doesn't work. Both strategies lose on the same days (0.3 corr). Adding even a .25x long leg cuts the Sharpe from 2,39 to 1.94
-
A short BTC hedge also doesn't work. The ladder doesn't hold much until *after* a dip, so a hedge that's pre-emptively sized doesn't accurately track the ladder exposure.
-
A 30 trend sleeve helps a tiny bit. The trend sleeve is this: ** **Long BTC if it's above it's price 30d ago, short if below. It adds about .1 Sharpe, with a couple extra percent return and the same drawdown.
Just for giggles and as a reward for those of you who stuck around until the end, here's the 3mo rolling Sharpe of the strategy!