I indexed 1.7 million LP positions on Meteora. Here's what the winners actually do differently.

文章目录
Milords,
For months now HALO has been crawling Meteora non-stop. Every position opened, every position closed, every wallet behind it. The index sits at 1,786,831 positions across 19,097 pools, from 4,034 wallets.
I built it to answer one question : what separates the LPs who actually make money from the ones who don't ?
Not what people say on the timeline. Not what looks good in a screenshot. What the on-chain data says, across 1.7 million positions.
Here's what came out.
The method, quickly
Closed positions only, on /SOL and /USDC pairs. After filtering out broken data, that's 1,703,644 positions, 13,752 pools and 4,023 wallets.
99.9% of these positions closed in the last 90 days, between August 11 and November 9, 2026. So this is a picture of the current market, not a cycle average.
PnL is net, in SOL, fees included and impermanent loss included, as valued by LP-Agent.
"Winners" means the top 10% of wallets by net PnL, among wallets with at least 20 closed positions. That's 315 wallets and 434,699 positions, compared against the other 2,833 wallets.
I also looked at elite tier, but that's 7 wallets. Worth looking at, not a law. I only mention them when they confirm what the top 10% shows.
One honest line before the findings : this describes what winners did, it doesn't prove that doing the same makes you a winner. Read it as patterns, not as a recipe.
The number that frames everything
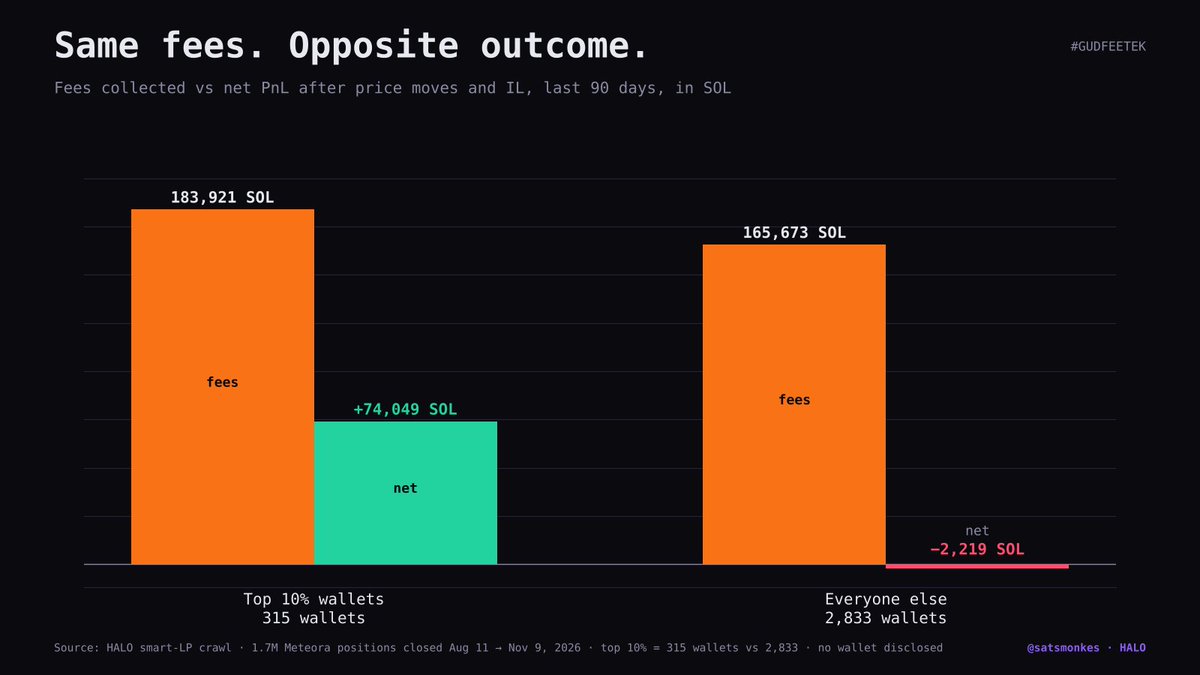
The top 10% : +74,049 SOL net.
The other 90% : −2,219 SOL net.
Read that again. 315 wallets made the money. 2,833 wallets, together, collected 165,673 SOL in fees over 90 days and still finished negative.
That's the whole story of LPing in two lines. The losing 90% didn't fail to earn fees. They earned plenty. They gave all of it back, and a bit more.
Finding 1 : win rate is not the edge
First surprise. Top 10% win rate : 65%. Everyone else : 63%.
Two points of difference. Winners and losers close green almost as often. The win rate everyone flexes in their screenshots barely separates the two groups.
So the edge isn't how often you win. The rest of the data shows where it actually is.
Finding 2 : winners hold longer
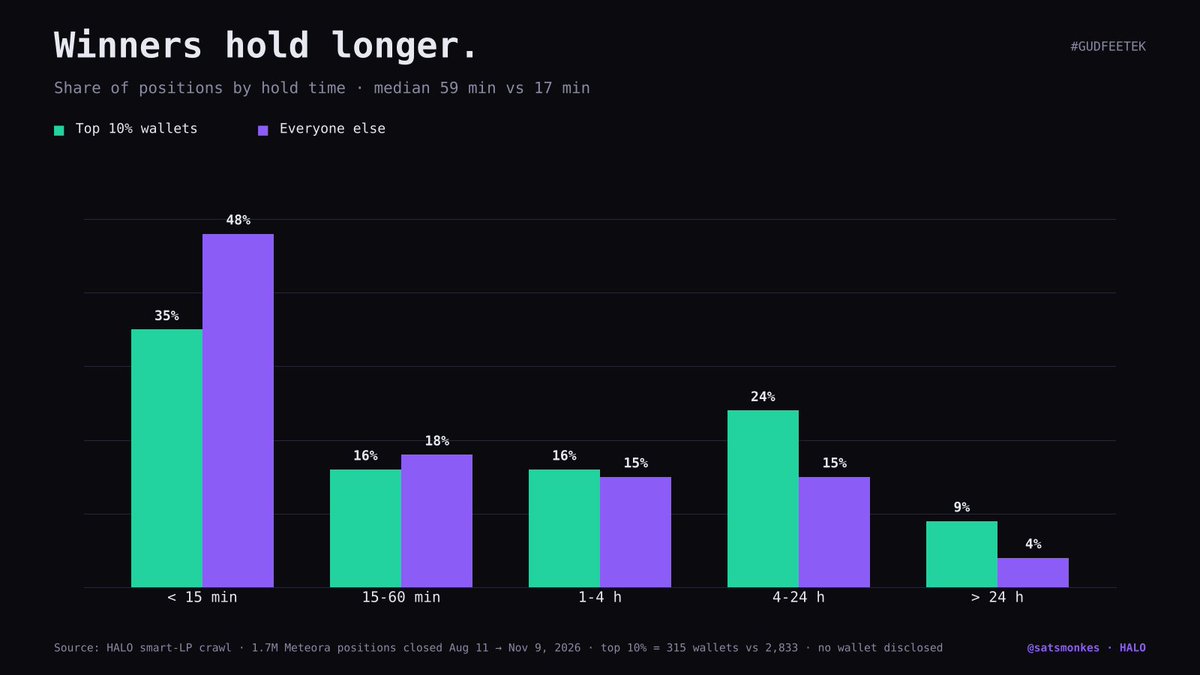
Median hold time : 59 minutes for the top 10%, 17 minutes for everyone else. 3.5x longer.
Positions closed in under 15 minutes : 35% for winners, 48% for the rest. Held more than 24 hours : 9% vs 4%.
The 7 elites push it further : 4.5 hours median against 22 minutes, and 17% of their positions held longer than a day.
My read : the losing majority is in and out. Close on the first red bin, re-enter on the next green candle, repeat. Every round trip pays the exit and leaves the fees on the table. The winners let the position work.
And here's the part that surprised me. Winners also close way more positions overall, 1,380 per wallet against 445. Longer holds AND more positions. They aren't babysitting one position. They run a lot of them in parallel and let each one breathe.
Finding 3 : winners keep their fees
This is the vanity metric section.
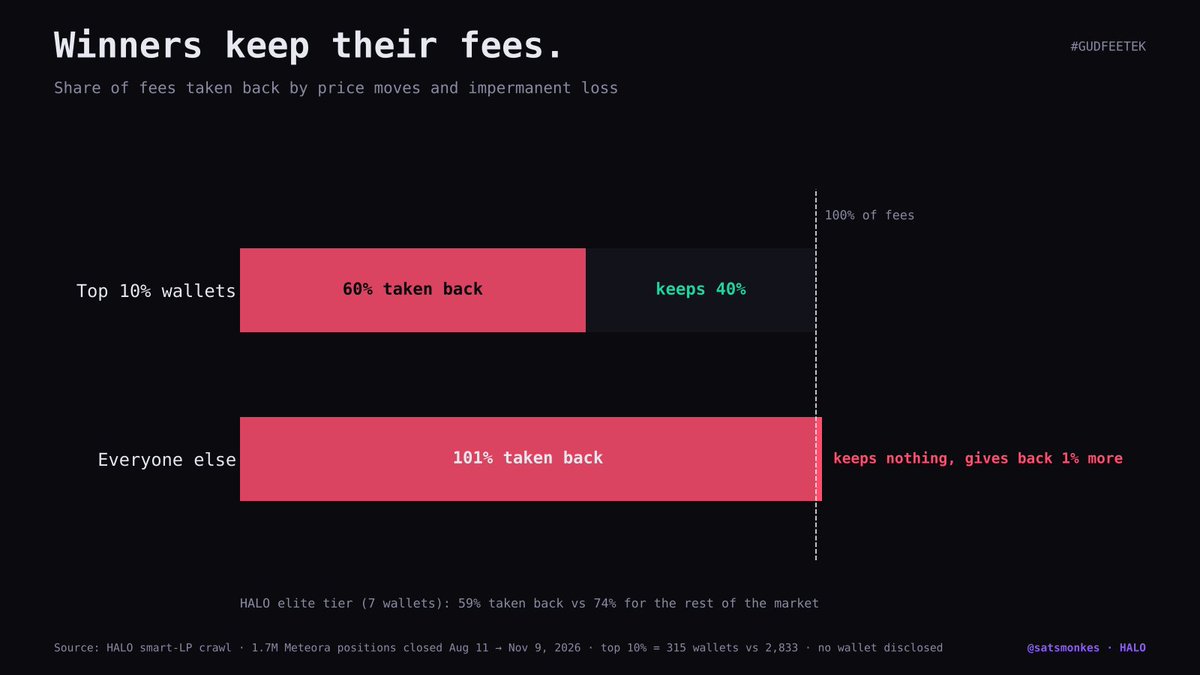
I measured how much of the fees gets taken back by price moves and impermanent loss.
Top 10% : 60% of their fees taken back. They keep 40%.
Everyone else : 101%. Everything they earned, plus more.
The elites : 59% taken back, against 74% for the rest of the market.
Every LP community posts fees. Almost nobody posts what's left after IL, and this is why. Same market, same pools, same 90 days. The difference between a winner and a loser isn't the fees they generate. It's the fees they keep.
Fees tell you how busy you were. Net tells you if it was worth it.
Finding 4 : winners size up
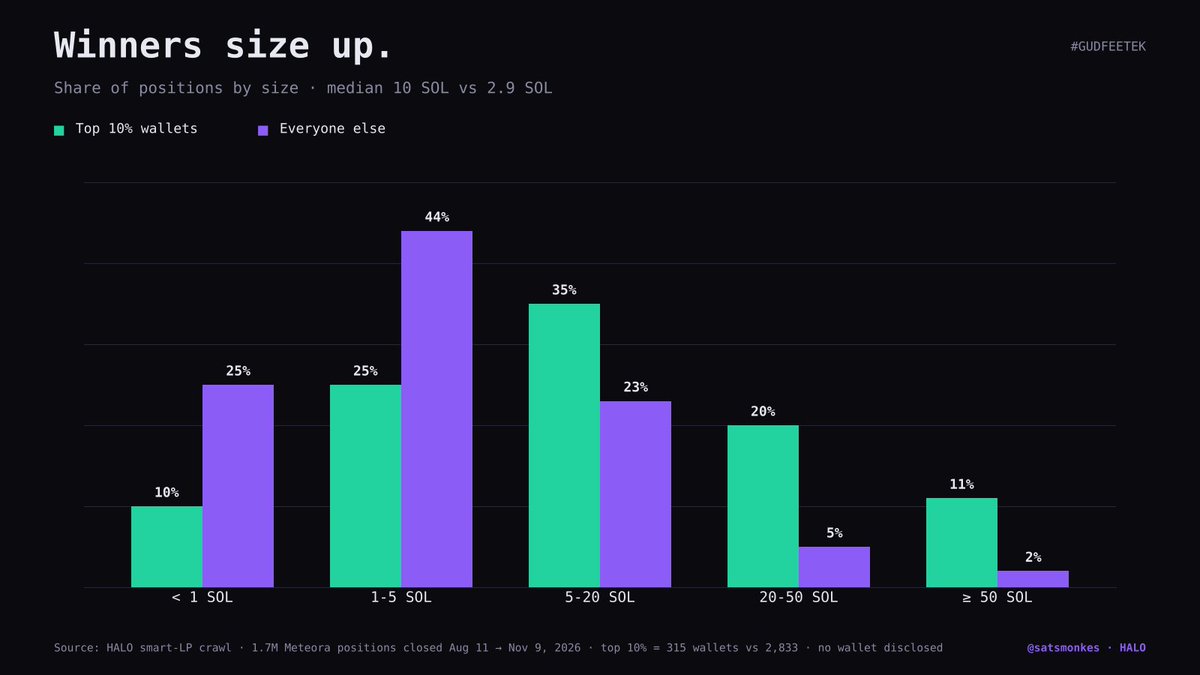
Median position size : 10 SOL for the top 10%, 2.9 SOL for the rest. Positions of 20 SOL or more : 31% vs 7%.
This is where correlation bites hardest, so let me be careful. Winners may size bigger because they already have the capital and the conviction, not the other way around. Sizing up doesn't turn a losing process into a winning one. It just makes it lose faster.
But there's a real lesson inside. At the median, winners and losers earn almost the same per position : 0.05% net against 0.04% of the size. The edge per position is thin. What turns a thin edge into real SOL is size, applied to a process that already holds over hundreds of positions.
Small size on a working process is a slow book. Big size on a broken one is a fast exit.
Finding 5 : winners farm the same pools
Share of positions that are a re-entry in the same pool : 87% for winners, 79% for the rest. Average positions per wallet and pool : 7.6 vs 4.7. Positions inside pools entered more than 10 times : 67% vs 48%.
Winners find a pool that works and they keep coming back to it. Same pool, new range, new position, again and again, as long as the volume is there.
If you've followed me for a while, you've seen it in real time. JOTCHUA farmed 14 times in a row on the same pair. That wasn't luck. That's the pattern.
Finding 6 : winners lean Spot over Bid-Ask
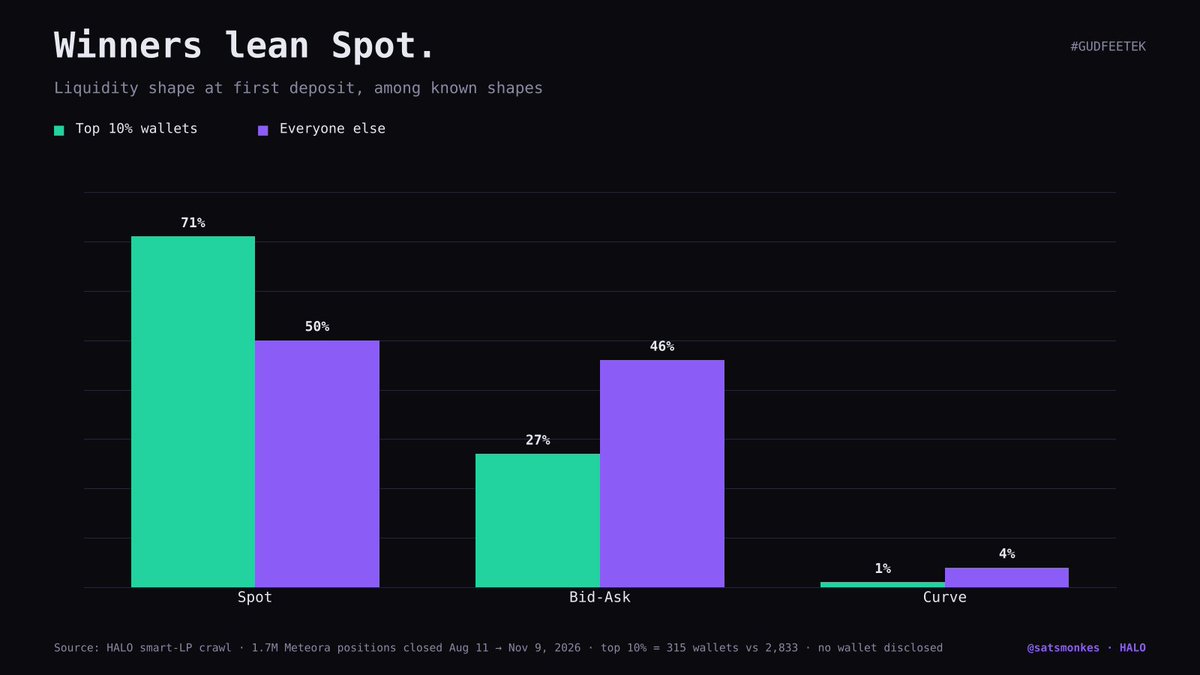
Top 10% : 71% Spot, 27% Bid-Ask. Everyone else : 50% Spot, 46% Bid-Ask. The elites : 90% Spot.
Caveat on this one : the shape is read from the first deposit only, and it's unknown for about 44% of positions. So take it as a lean, not a rule.
I won't pretend this one doesn't sting a little, i love the bid-ask. But read it right. Bid-Ask is a DCA tool, built to catch a retrace on a token you actually want to own. A lot of people use it as a dip-catching bet on memecoins that never come back. That's not the tool failing, that's the tool used for the wrong job. On the fast momentum plays, where most of this volume happens, the winners pick Spot.
It's the rule from my LP playbook. Short duration and momentum in motion, Spot. Waiting for a retrace on a longer horizon, Bid-Ask.
What doesn't matter
This part is just as useful.
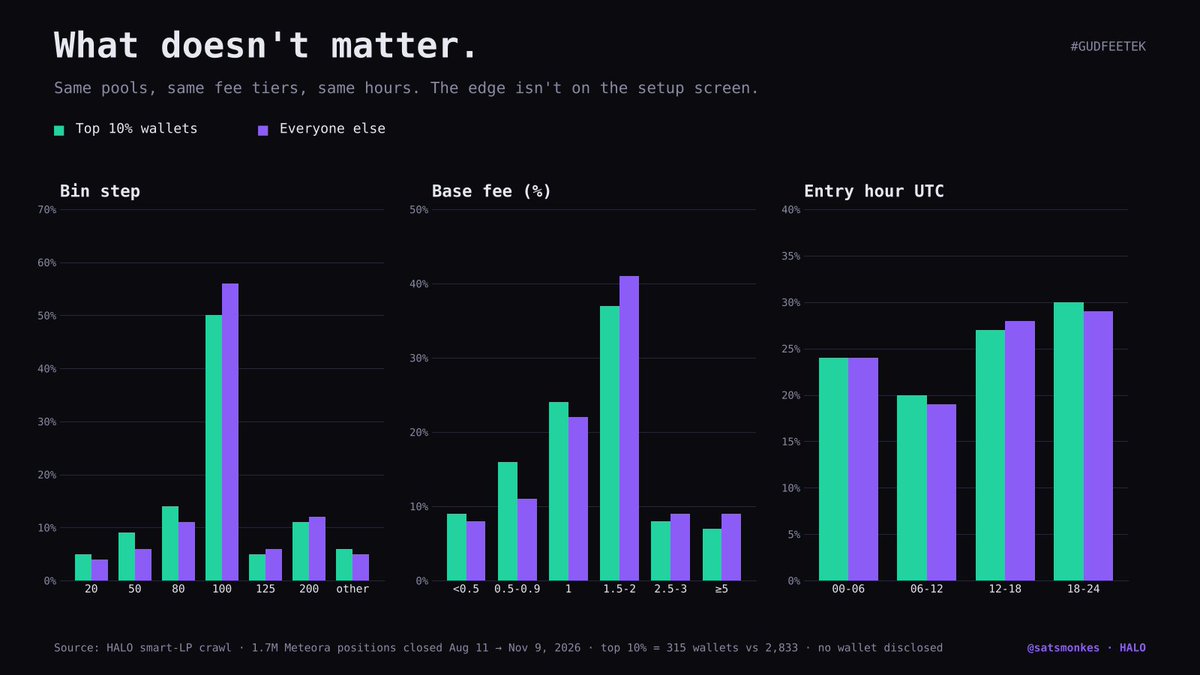
Bin step : median 100 for both groups. Base fee : 1.5% vs 2%, with almost identical distributions. Quote asset : 96% SOL on both sides. Entry hour and day of the week : no consistent gap. Range width : 107% vs 103%, around 70 bins, roughly −50% / +1% around the entry price for both.
Everyone uses roughly the same range, the same pools, the same fee tiers, at the same hours. Hours of debate about bin steps, fee tiers and the perfect range width, and the data says winners and losers make the same choices there.
The setup screen is not where the edge lives. The edge lives in behaviour. How long you hold. How much of your fees you keep. How big you size once it works. How often you come back to what works.
What i take from it
Stop measuring yourself on fees. Measure net.
Let the position work. If your median hold is under 20 minutes, there's a good chance the exits cost you more than the fees pay.
Find the pools that work for you, and farm them.
Size is earned. By a process that holds over hundreds of positions, not by one green week.
Stop optimizing the setup screen. Optimize your behaviour.
Boring is the strategy. It's just a point, play the next one.
Where this comes from
HALO crawls these numbers every day, and the Milords use them live : the pools the smart LPs are entering, where the smart liquidity sits, and how your own wallet compares. Access goes through the discord, link in my bio, and seats open through the Meteora referral SATSMONKES.
No wallet named, nothing individual, everything above is aggregated. Not financial advice, just what 1.7 million positions say.
gud fee tek 🖨️