How To Trade Like Future Market Wizard Martin Luk (#1 USIC winner, 969.8% verified retur)

文章目录
部分视频或图片暂未收录,已在正文保留提示;需要时可查看原文。查看原文 ↗
Martin Luk's stellar performance in 2025 was not a one-year heater.
His 2026 USIC performance through August was 844.5%, and he topped it with a 150%+ month in October. Zero options. Zero 0DTEs. Zero futures.
And he's not doing it with a small account.
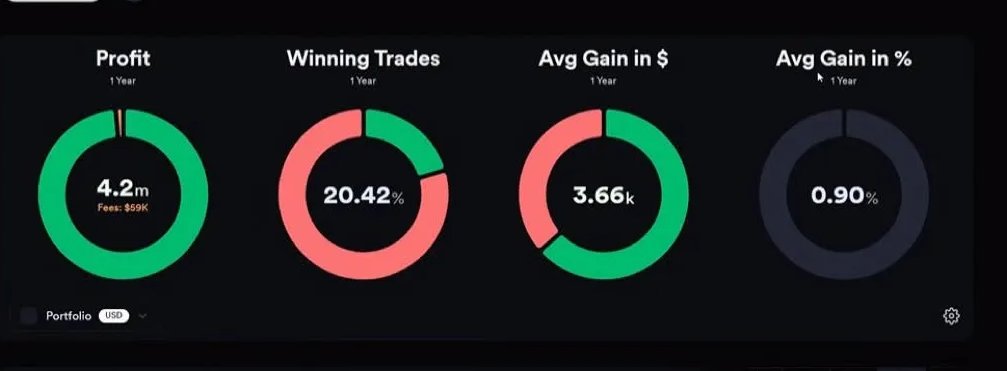
Martin Luk is verified on @Kinfo with an account size of over $4M
And the best part, he has streamed it all live on Youtube.
Over the last few months I've watched and logged 112 of his streams (211 hours of raw footage), reconstructing ~100% of his multi-day swing trades. Independently blind checked against his Discord journal.
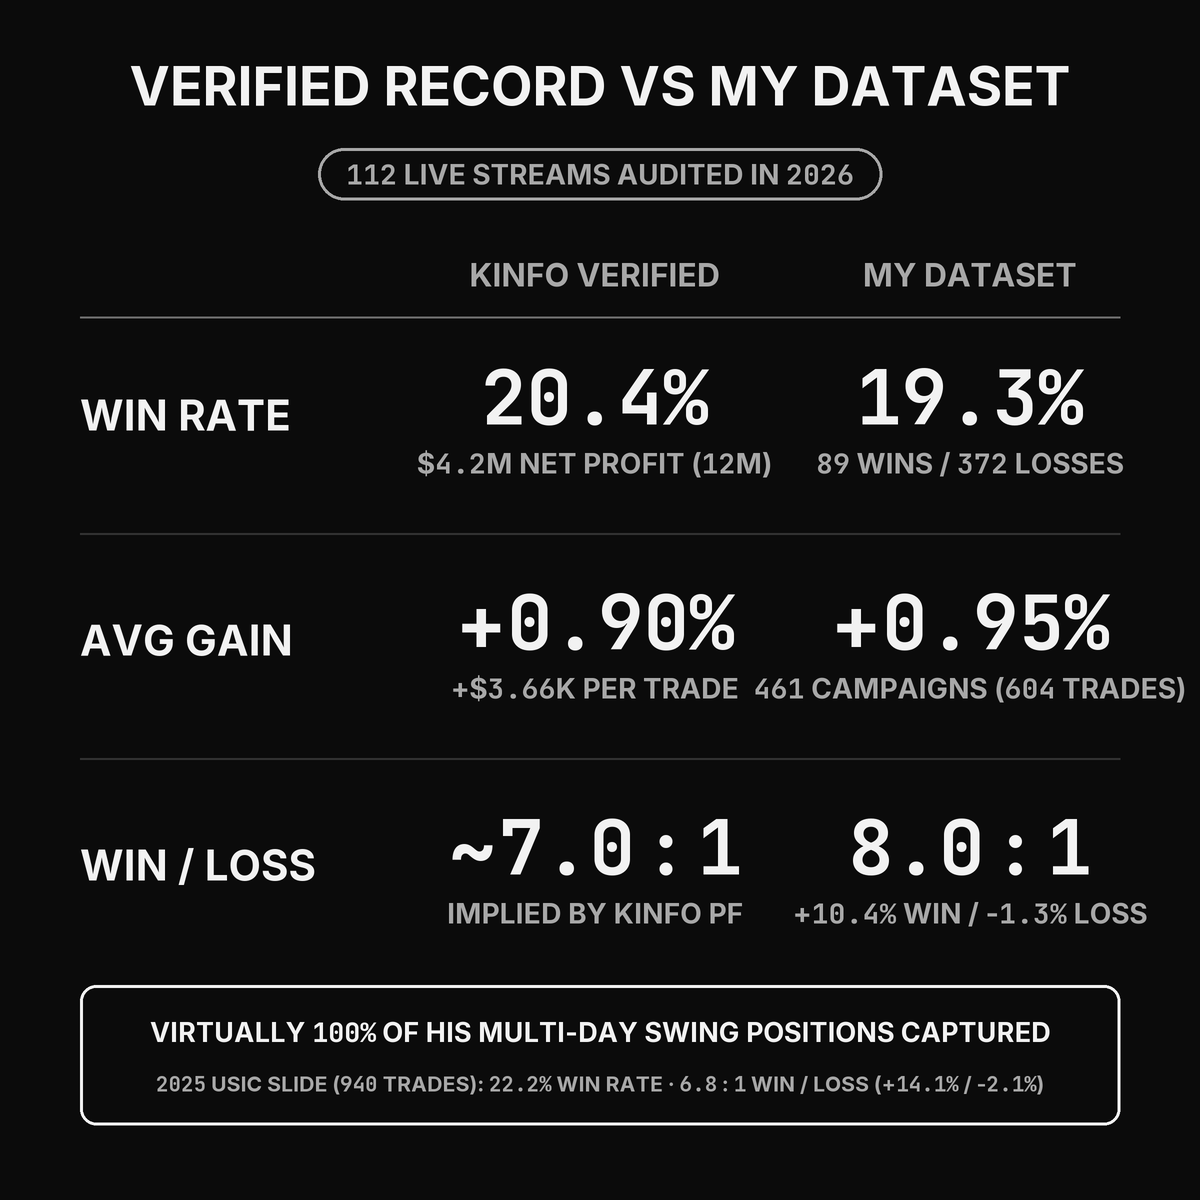
Note that the Kinfo verified is for the last 12 months, while my dataset is for 2026
So let's look at how he actually trades and what allows him to make such wild returns.
One trade pays for his next 54 stops
In January 2021, when Luk was an 18-year-old freshman who knew nothing about charts, risk management or position sizing, he bought GME at the $501 pre-market top. He had no stop loss. He lost half his savings.
Lesson learned.
Three years later, when GME gapped up after @TheRoaringKitty tweeted for the first time in years, he played it differently.
Most of us saw a meme stock up 40% pre-market. Luk saw an Episodic Pivot with historic volume.
He entered on the 1-minute opening range break, with a 3% stop. He scaled out over the next two days.
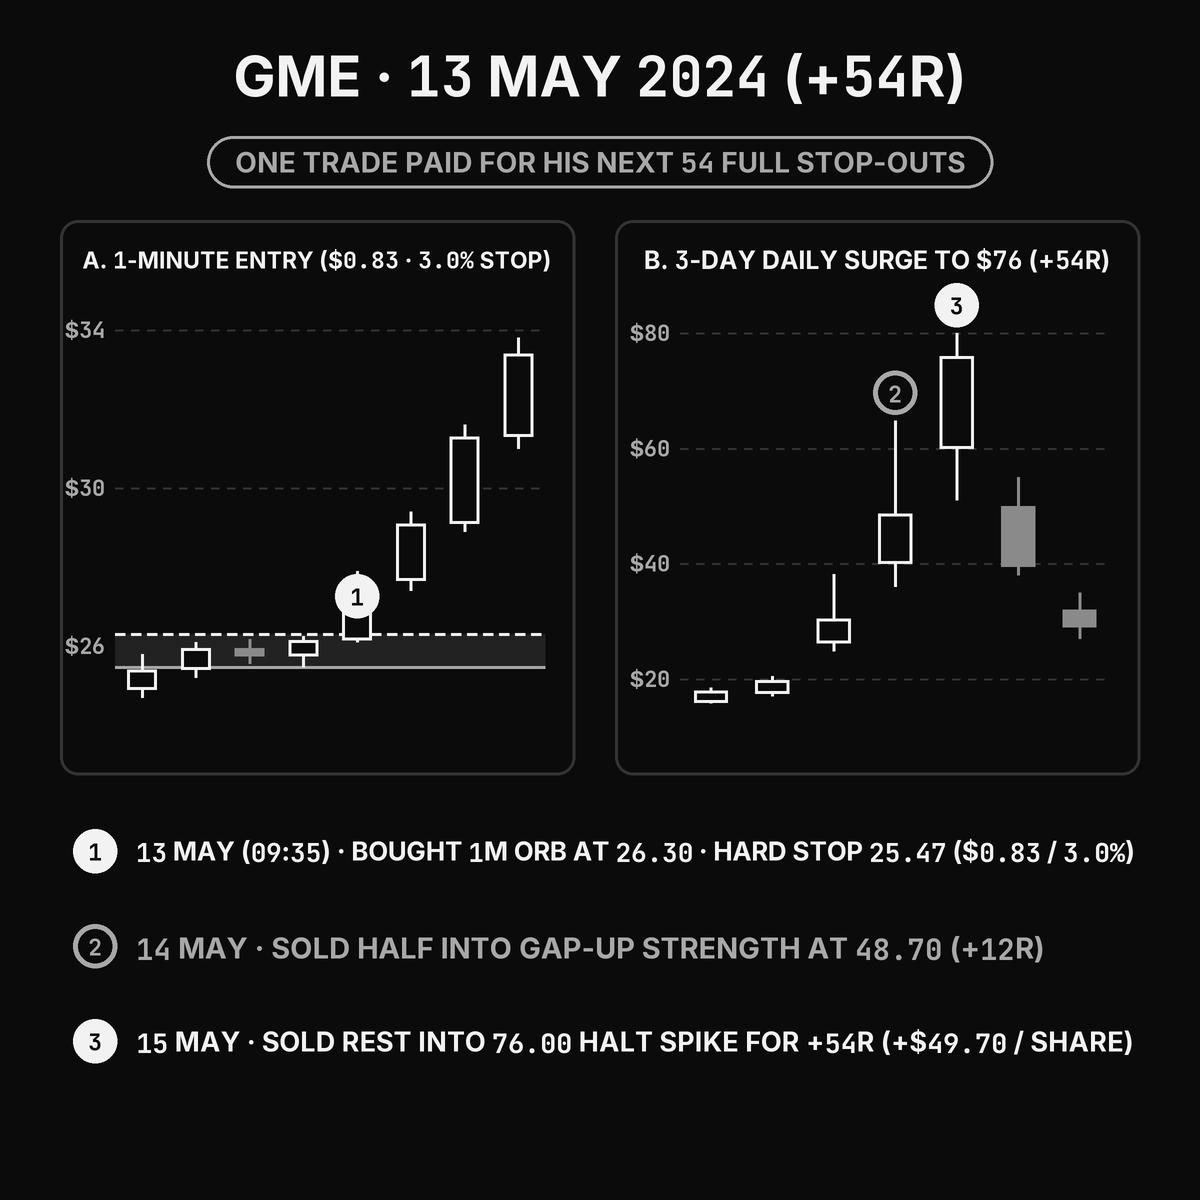
When Martin Luk traded GME 3 years after his GME blow-up he had learned his lesson
He made 54R on that trade alone. Meaning that one trade paid for his next 54 full stop-outs.
At a 20% win rate, we do not need to be right very often when a single trade pays for two months of paper cuts.
Tight Stops Create Big Positions (Without Blowing Up Our Account)
When we look at Luk's stats (-1.30% average loss, 1.28% median stop), it is easy to confuse stop distance on the chart with account risk.
Every position he puts on is governed by one formula:
[未转换内容,参见原始 JSON]
In 2024 and 2025, Luk risked roughly 0.50% of total equity on a standard trade.
In 2026, when his account had reached multi-million-dollar size, he reduced his standard risk per trade down to 0.30% (dropping to 0.15% to 0.25% during cold streaks, and sizing up to 1.0% to 1.5% only on once-a-year high conviction trades).
His unusually tight stop doesn't only keep his losers small, but it allows him to size up with the same $-risk.
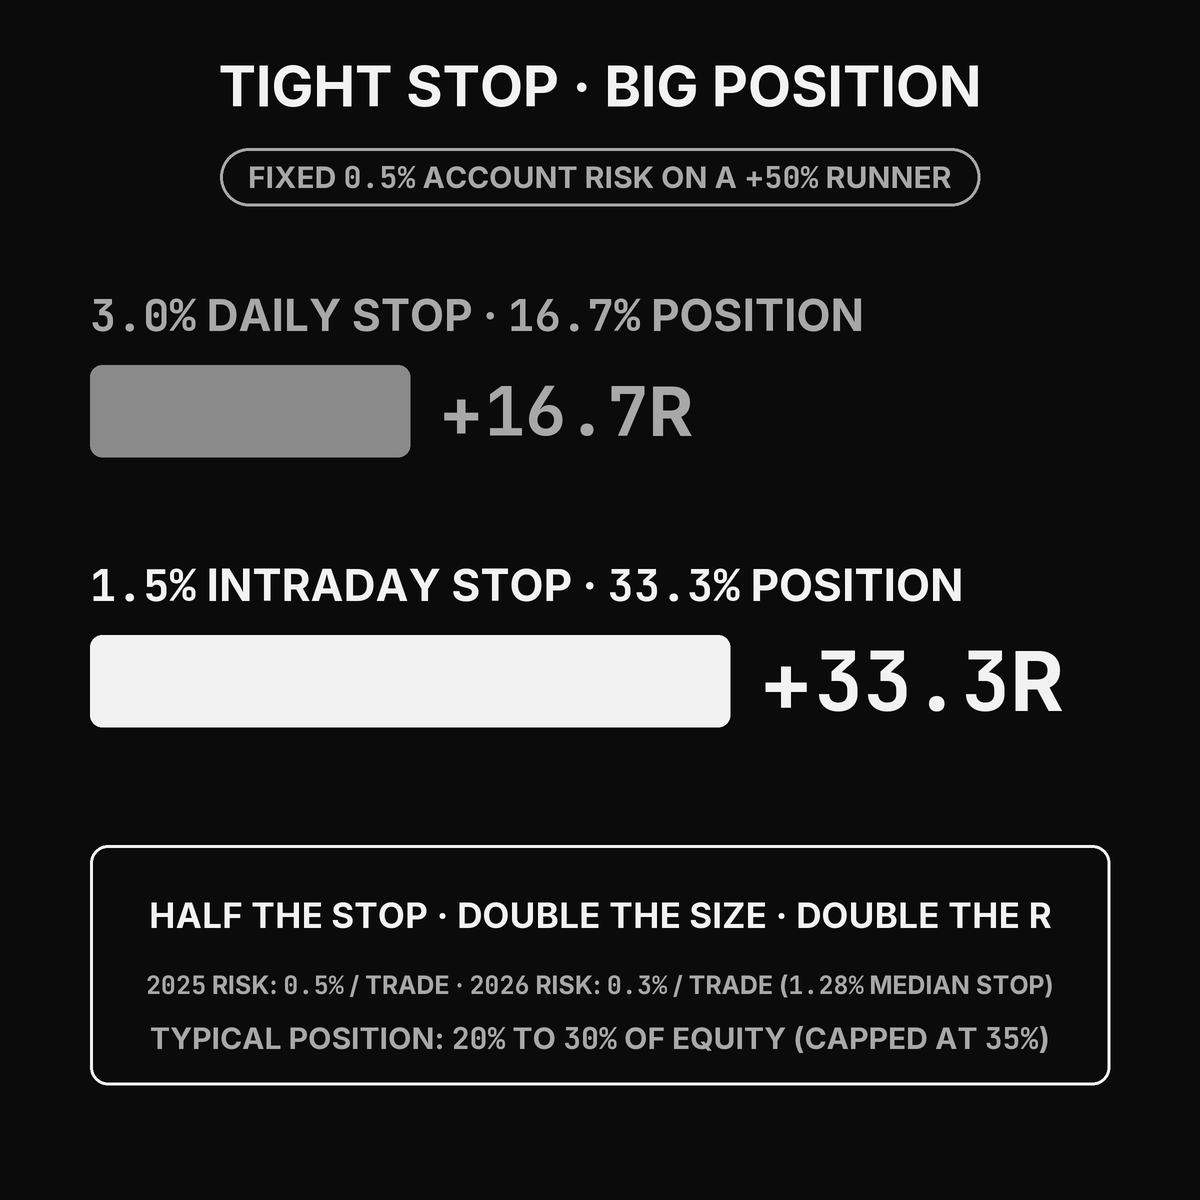
A tight stop allows much bigger positions with the same $-risk. And it also improves our R per trade
Comparing two traders it becomes evident:
Trader A (Daily Chart Stop = 3.0%): Risking 0.5% of equity divided by a 3.0% stop puts 16.7% of the account into the trade. A +50% move pays +16.7R (+8.35% to total account equity).
Martin Luk (Intraday 1m/5m Stop = 1.5%): Risking the exact same 0.5% of equity divided by a 1.5% intraday stop puts 33.3% of the account into the trade. The exact same +50% move pays +33.3R (+16.65% to total account equity).
‼️If the trade fails, both traders lose the exact same -0.50% of their account. If the trade works, Luk makes double the R and double the $-return on the exact same move in the stock.
That is why he evolved away from pure daily-chart breakout entries after studying @Qullamaggie
Comparing the two traders highlights the similarities, and what separates them.
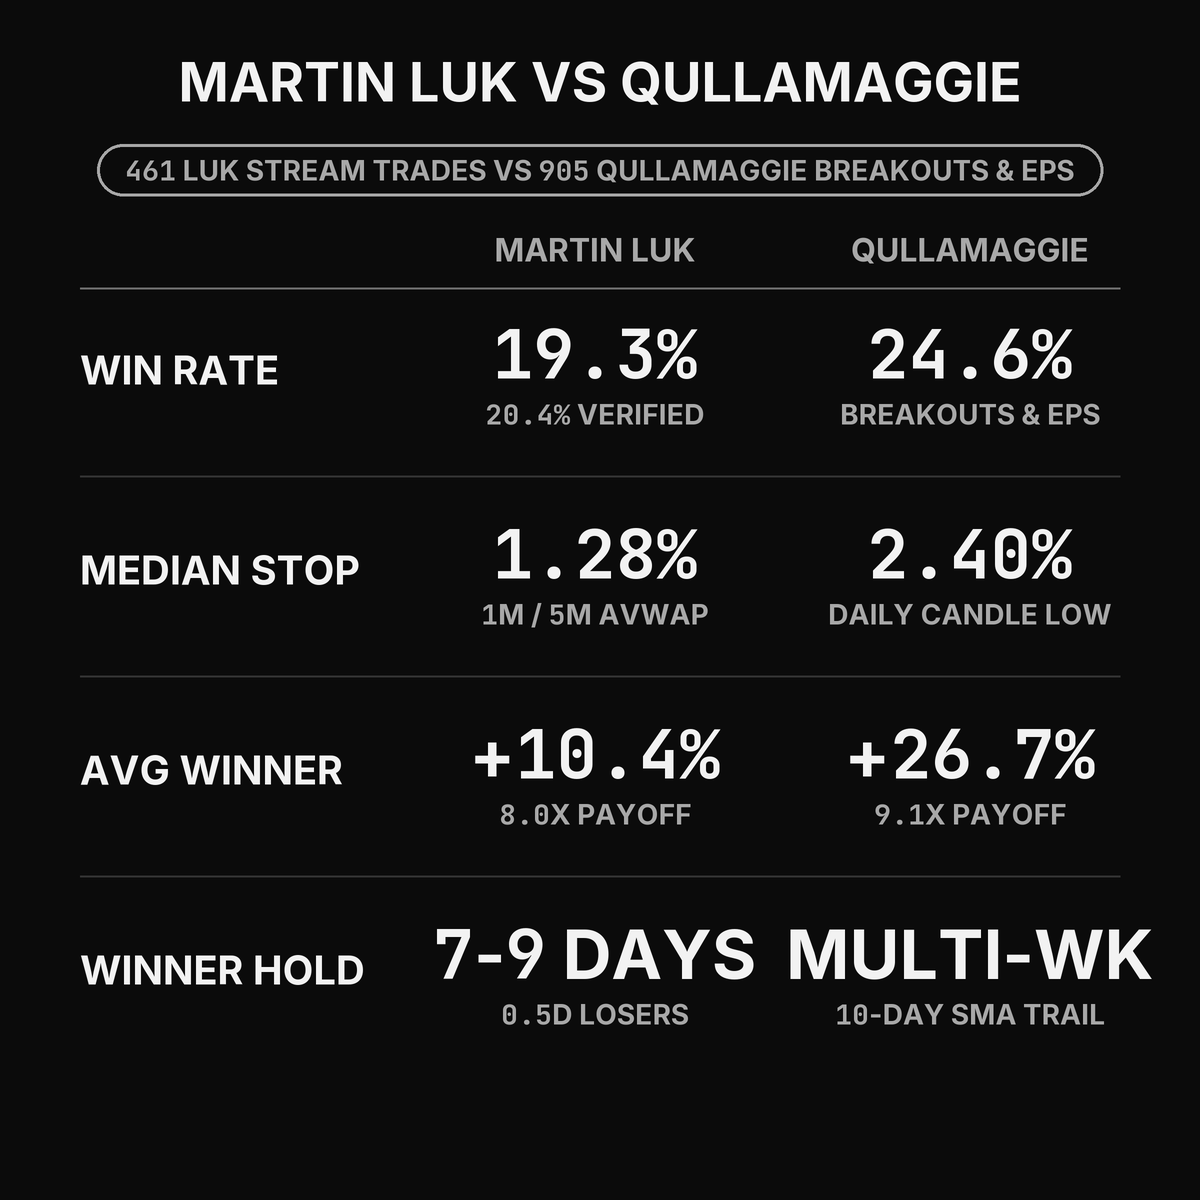
The raw stats of two legends. Making generational wealth can be done in several ways
Luk talked about this in his @Traderlion_ interview with @RichardMoglen:
Even on a three million dollar account right now, I'm still able to enter using the one-minute chart and five-minute chart with tight stops... Because my stops are so tight, usually the stop size is only 1% or 1.5% and rarely more than 2% or 3%, so I can easily get a 20% or 30% position size while only risking 0.3% to 0.5%.
I like having tight stops so that I can build a larger position size and look for a larger R-multiple. My way is that I'm okay getting stopped out a lot of times, two or three times in a single stock, and then once I catch the move I can easily get 10R or 20R.
Holding Times, Position Sizing & How He Runs 200% to 350% Margin on 0.3% Risk
When Luk's numbers are discussed, there's always the four inevitable questions:
-
How long does he actually hold his long winners?
-
How long does he hold his shorts and his losers?
-
What is his normal position size?
-
How can someone risking 0.3% to 0.5% per trade make +60% to +150% in a single month without options?
Here are his stats:
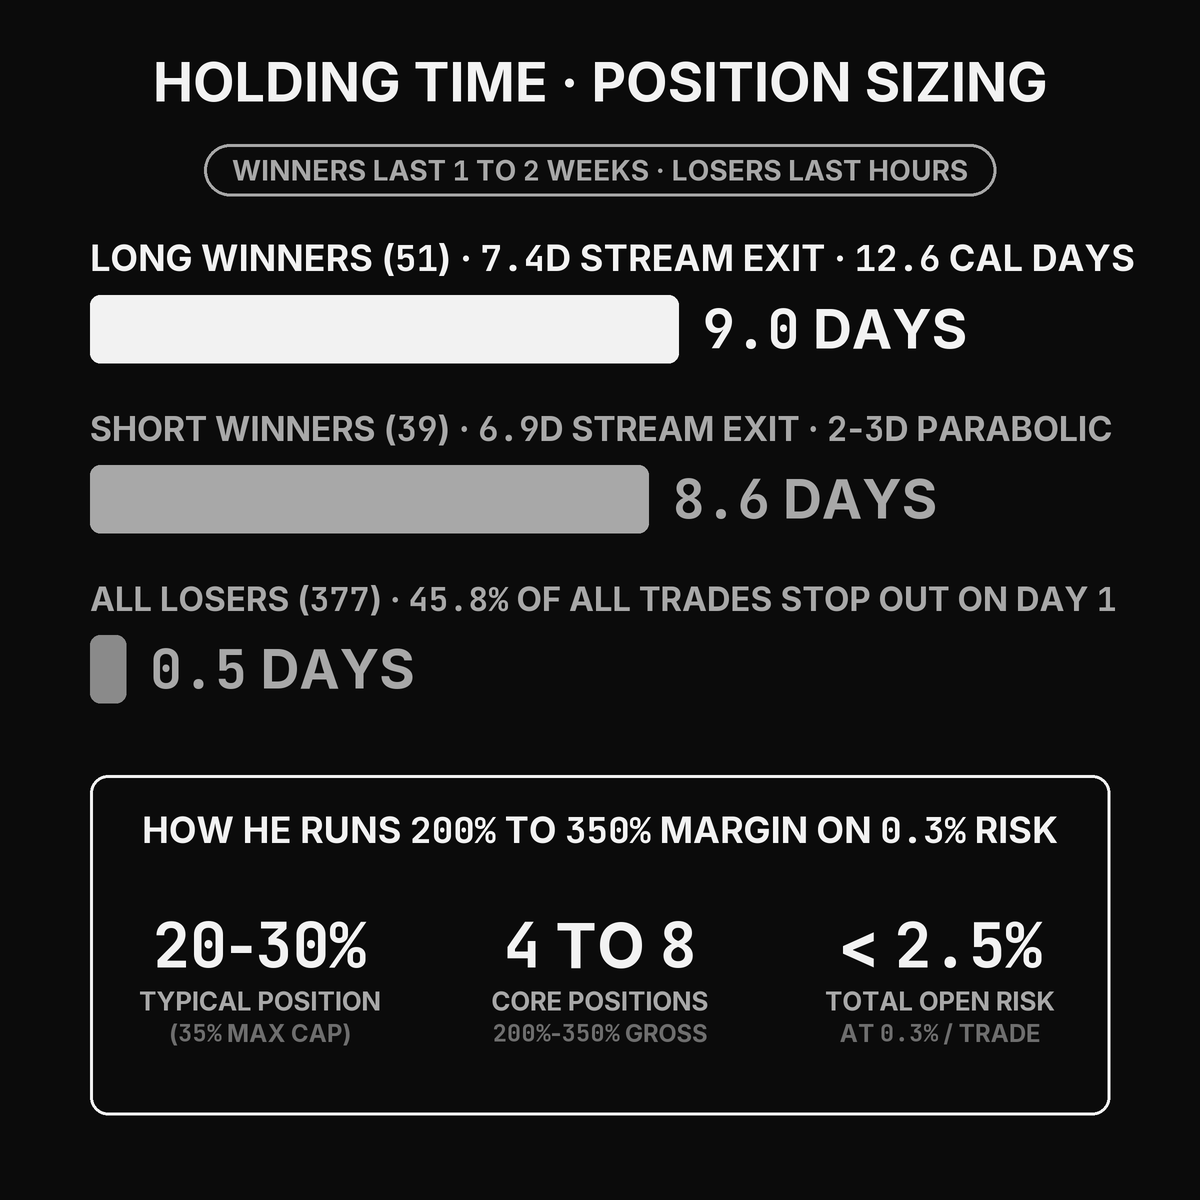
The stats you need to make 150%+ in a month on a multi-million dollar account
How Long He Holds Winners vs. Losers
-
Long Winners: Average 9.0 trading days when trailed to the 9 EMA daily close, and 7.4 trading days based on his actual observed stream exits.
-
Short Winners: Average 8.6 trading days on the 9 EMA trail, 6.9 trading days on observed stream exits, and just 2 to 3 trading days on parabolic blow-offs and weak-bounce washouts.
-
All Losers: Average 0.54 trading days. 45.8% of every trade he takes (and 53.7% of all losers) stops out on Day 1, often within 15 to 90 minutes of entry.
Position Sizing & The 200% to 350% Margin Engine
Because of his tight intraday stop (<1.5%), risking 0.3% - 0.5% of account automatically puts 20% to 30% of his account into a single stock (with a hard maximum cap of 35% on any one name).
That would surely put him out of buying power quickly? It happens, but not as quickly as one would think.
In August, when he was holding 12 liquid leaders at the same time (DELL, INTC, MU, PANW, CRWD, NET, etc) all at 25%-30% each, he hit a ceiling.
I think it's around 315%... I think I'll run out of firepower today. I want to buy the SMCI on this pullback on the 9 EMA one-minute chart, but I ran out of buying power.
So how does he do it? Let's look at how it plays out when a hot market gives him 6-8 setups which work..
-
He earns the right to add more exposure: Once Position #1 moves to +3R to +5R (often on Day 1 or Day 2), he trims 10% to 15% and raises his stop on the remaining 85% to breakeven. That position is now risk-free.
-
He stacks 4 to 10+ positions into 200% to 350% gross margin with IBKR Portfolio Margin: Standard Reg-T margin caps overnight exposure at 200%, but on a seven-figure Interactive Brokers account with Portfolio Margin (which requires only 15% to 30% margin on diversified liquid leaders like DELL, MU, PANW, and CRWD), holding 8 to 12 positions at 25% to 30% each takes his gross exposure to 200% to 350% (peaking at 280% in 2025, 250% in May 2026, and 315% to 350% in August 2026, right where his IBKR buying power maxed out).
-
Total open risk to account stays under 2.5%: Even at 300% gross exposure across 8 positions, if every single trade stopped out at its initial -0.3% stop at the exact same second, his account would only lose -2.4% (and in practice half of those stops are already at breakeven).
-
Fast 1-to-2 week swing turnover compounds inside a single month: Because his winners resolve in 6 to 9 trading days, he does not sit in one static portfolio for a month. In a trending month, he turns over 200% to 350% exposure across two or three waves of +10% to +25% movers (+10R to +25R each).
The combination of tight stops, large position size, portefolio margin, and fast turnover is the exact math behind his biggest USIC months:
-
+64.2% in May 2025
-
+89.0% in September 2025
-
+54.9% in November 2025
-
+62.0% in April 2026
-
+85.8% in July 2026
-
+150.64% in October 2026
As Luk said on stream:
"[Without margin in 2025] probably only like maybe 300 or 400%. Definitely more than half of my gains are from the margin.
I will break down the exact trades, and his trade management, for his massive months in a video or article. Sign up at app.qullamaggiedeepdive.com to not miss out.
Why Martin Luk Stopped Buying Daily Base Breakouts (65.9% Pullbacks vs. 2.3% Breakouts)
Fintwit, Discords and the private communities spend most of their evenings drawing horizontal resistance lines across multi-week bases and buying the breakout above the pivot.
When I classified all of Martin Luk's long trades in my 2026 dataset by setup type, horizontal base breakouts were almost nonexistent:
Why did he abandon daily base breakouts? He has given three reasons:
-
Clean multi-week bases and breakouts stopped working for him after 2024: "Forming a really tight range and then a really clean breakout, that's really uncommon in the past 1 or 2 years... Last year I started to see many of my losing trades took out my stop at LOD and rallied back to the highs within the same day or in a few days. Then I started to make the change."
-
Repeated shakeouts on breakout entries: "I just got stopped out multiple times when I'm buying the opening range breakouts and then get stopped out on the shakeouts after 2024... if the market loves shaking out, then I'm going to trade the shakeout instead of buying the opening range highs."
-
50% tighter stops and 2x the position size: In one of his studies on QS, he found that buying the pullback into converging 9/21/50 EMAs on the 1-hour chart gave him a 1.78% stop instead of waiting for the previous day's high breakout: "My stop can be tightened by 50% and you can build 100% larger position sizing compared to using previous day high."
*So, instead Luk *waits for the stock to prove its strength first, lets it pull back for 3 to 7 days into the rising 9 EMA, 21 EMA, and Anchored VWAP, and executes on an intraday timeframe:
Entry techniques for long trades:
| Intraday Entry Trigger | Share of Entries |
|---|---|
| AVWAP / VWAP reclaim or reject | 29.6% |
| Intraday wedge / micro-trendline break | 19.2% |
| 1m / 5m / 15m Opening Range Breakout | 17.1% |
| Opening flush undercut & reclaim | 10.4% |
IONQ in May 2026, demonstrates the difference between trading the breakout vs pullback
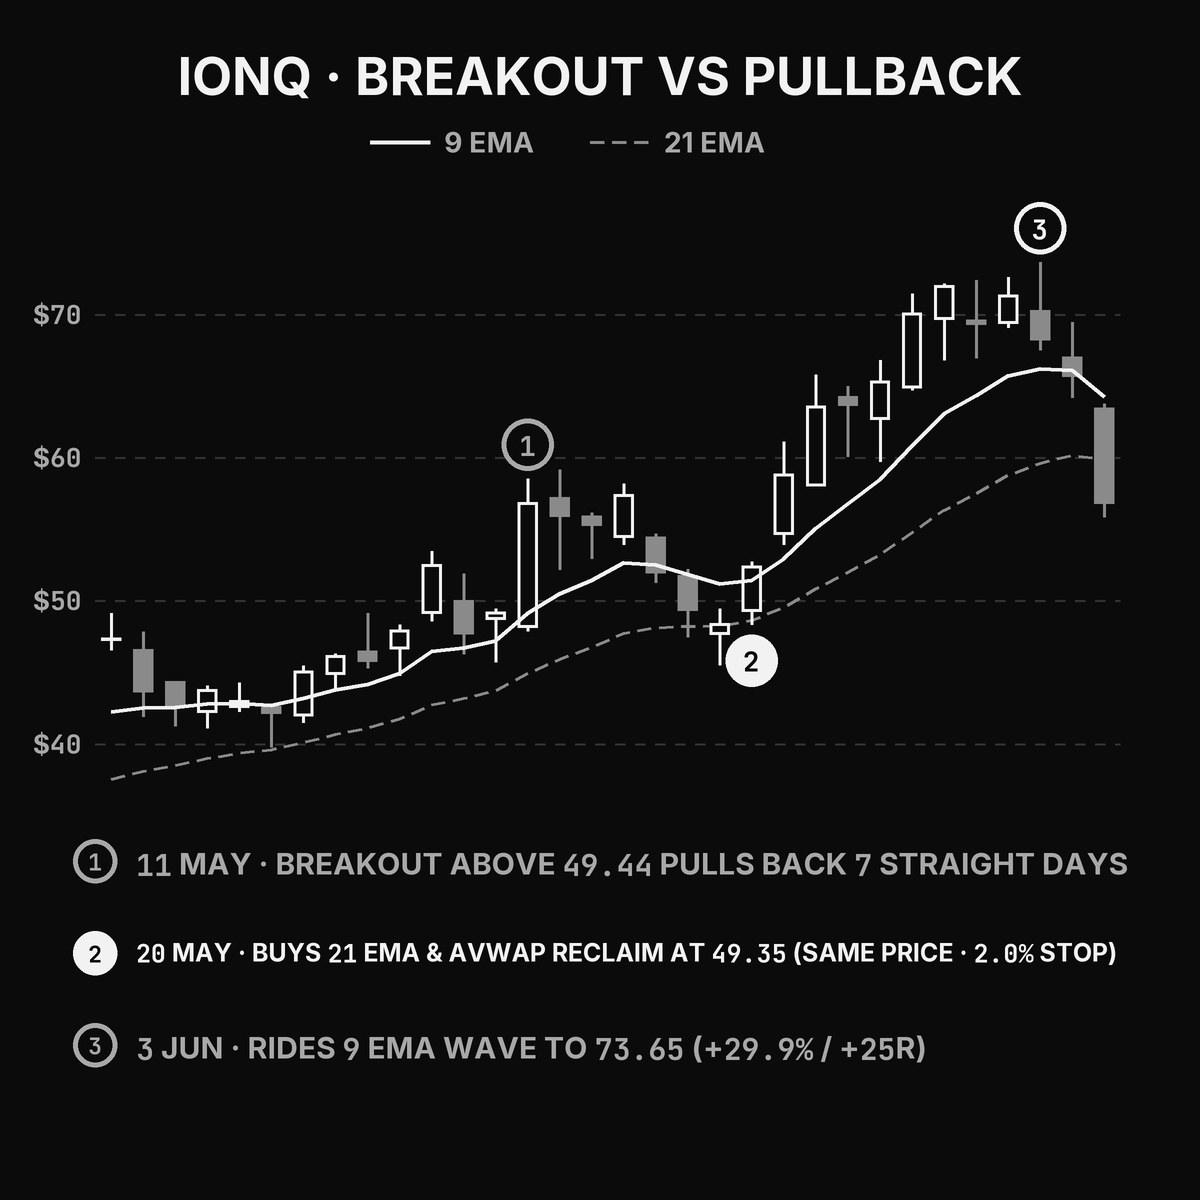
The difference between the entry a breakout trader would take vs the entry Martin Luk took
The breakout trader would've locked in some early gains, and moved his stop to breakeven on day 3. Martin took a pullback entry, and made almost 30% and 25R.
How the Short Side Produced About 50% of His Net R
Besides the horizontal trend lines, Fintwit, Discords and the trading communities out there are filled with "Cash is a position" due to the poor market conditions. And everyone knows the truth is most of us get chopped up because we're forcing longs.
In my 2026 dataset, 42% of Luk's trades are shorts. He generated more than half his net R with shorts. And his shorts have a 23.5% winrate, vs his long which have 16.9%.
How He Knows When to Flip from Long to Short
He does not rely on macro forecasts, complex breadth oscillators or market filters. He primarily uses two real-time signals:
-
His own trade feedback (#1 indicator): When high-quality long setups in leading stocks stop working and he hits consecutive stop-outs, he immediately stops forcing longs.
-
Watchlist breadth: When he flips through his daily scan of ~100 momentum stocks and 90 out of 100 look terrible (gapping down, failing breakouts, trading below declining 9 and 21 EMAs), he flips his playbook to the short side.
His Two Core Short Setups
-
Weak Bounce into Declining 9 / 21 EMA & AVWAP: Once a former leader breaks down below its 21 EMA on volume, he waits for a weak 2-to-4 day bounce on light volume right back into the declining 9 EMA, 21 EMA, or breakdown AVWAP, and shorts the intraday failure.
-
Parabolic Short: When an extended leader goes vertical for 5 to 10 days in a row and gaps up into a climax top far above its 9 EMA, he shorts the first 1-minute or 5-minute Opening Range Breakdown / VWAP failure with a razor-thin stop above the intraday high.
💡Note: Both of these short setups are setups Qullamaggie traded (only he traded the breakdown, not the weak bounce), but most are only familiar with the parabolic short. That's why it's so important to do your own studies!
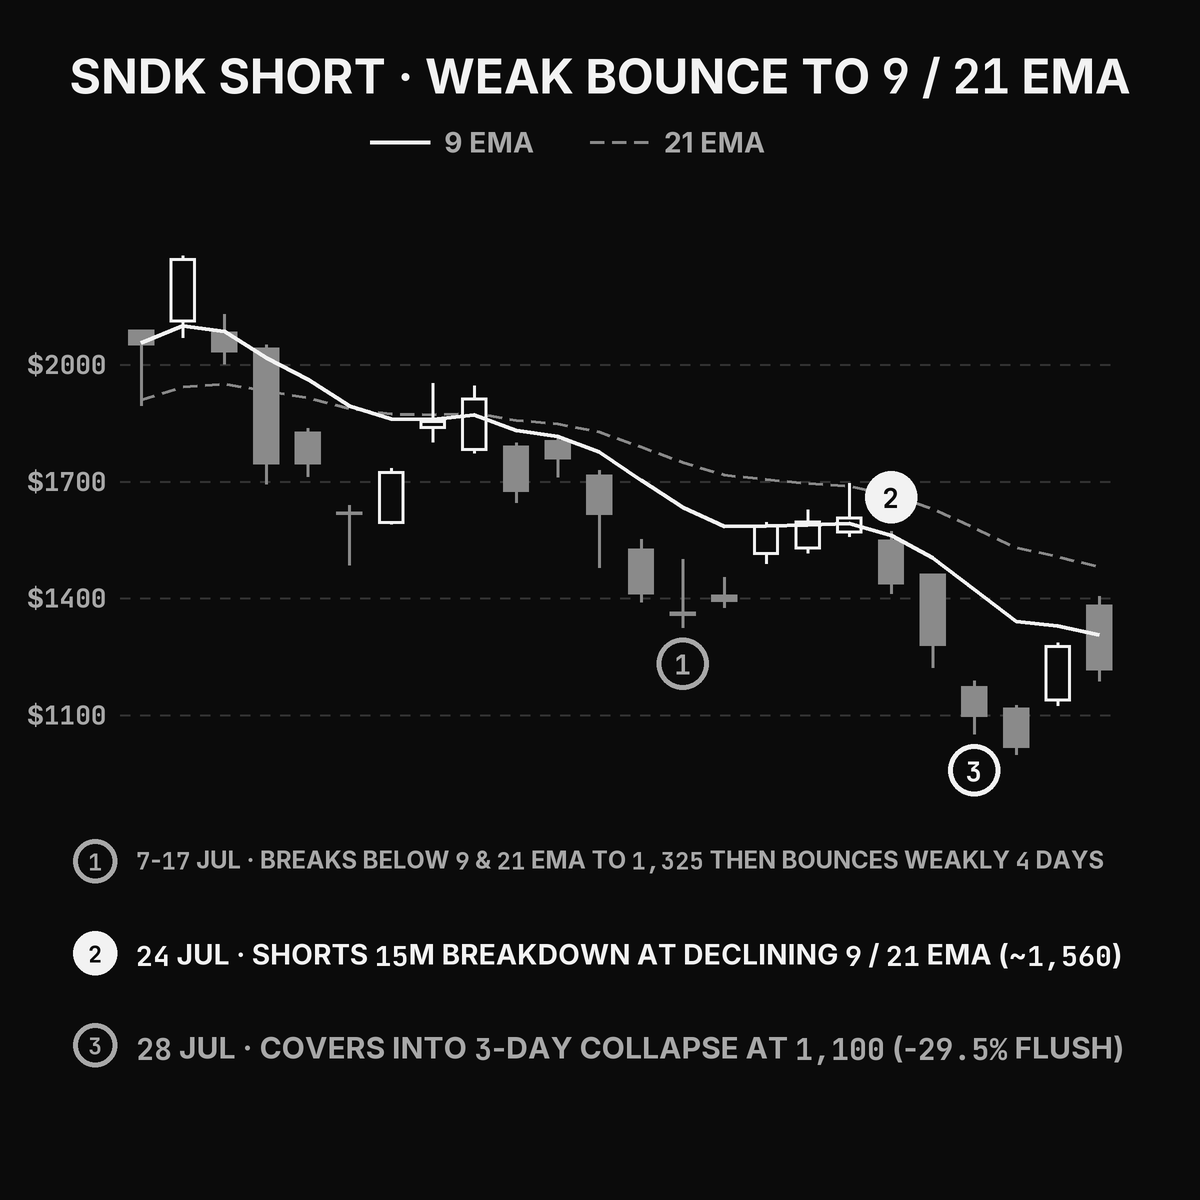
SNDK Short in July was a textbook Weak Bounce short.
-
The Breakdown & Weak Bounce (July 7–23): After topping above $2,100 in June, SNDK broke down below its 9 and 21 EMAs on July 7 and flushed to $1,325.03 on July 17. It then bounced weakly for four sessions right back into the declining 9 EMA
-
The Short Re-Entry (July 24): Luk's first short attempt on Thursday July 23 was stopped out, so he waited for SNDK to reject the declining daily 9/21 EMA on July 24 and re-entered around ~$1,560 on a 15-minute breakdown ("I did get stopped out, but I re-entered it at the 21 EMA daily, 60-minute 150 EMA, 15-minute breakdown").
-
Holding Through First Support (July 27): As SNDK dropped into $1,300 pivot support on Monday July 27, Luk held his full short because the broader indices (SPY and IWM) were only on Day 1 of their breakdown ("Here [1,300] is a pretty decent level I could peel some off. But I won't... I would prefer covering more when the indices are more extended into the downside").
-
Covering Into Panic Weakness (July 28): The next morning, SNDK gapped down another 4% and flushed through the $1,100 round-number mark - almost 30% in a few days! Luk covered into the panic flush at $1,100: "SNDK falls below the 1100 mark. I just kind of like the number 1100 — that's why I covered it into the level. Sometimes you don't need a really solid reason to cover a short into weakness... There will always be another opportunity on the short side, and the entry price of your next short is generally going to be higher."
Sell Rules: Why He Trims 15% and Trails 85% on The Daily Close
In 2024, Luk sold 30% to 50% of his positions into the first spike at +2R or +3R.
But when reviewing his trading, he realized that selling half early was cutting the legs off his biggest 20R+ trend runners. In 2025 and 2026, he overhauled his exit rules into a two-part system:
-
Trim only 10% to 15% at +3R to +5R to "finance the stop": Selling 15% at +4R banks 0.60R of realized profit. That small trim pays for raising the stop on the remaining 85% to breakeven (or keeps the worst-case loss near zero if he leaves the stop at -1R while a trend establishes).
-
Trail the 85% to 90% core on the daily close: Once a trade is financed, he turns off the 1-minute chart for exits. He doesn't sell because a stock wicks below the 9 day EMA. The stock must close below the 9 EMA (for fast leaders) or 21 EMA (for steady trends) to trigger an exit.
The benefit of this 2-part exit strategy becomes evident when reviewing trades like MRVL (March 31st to May 7th, +57% or +25R).
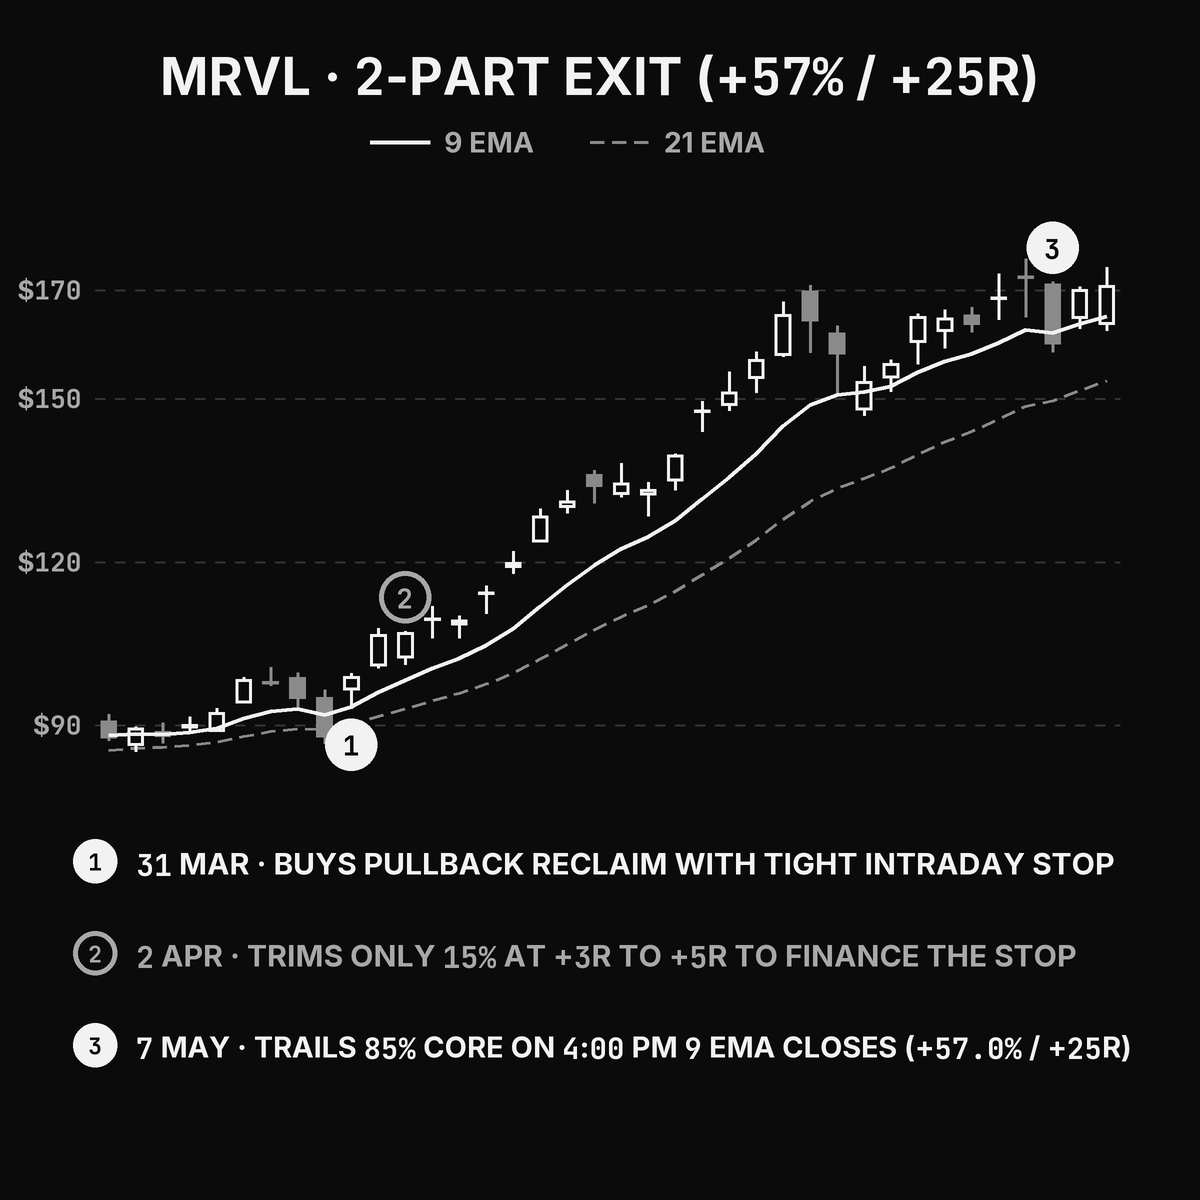
MRVL demonstrates why a 2-part exit strategy works so good
-
He entered the pullback reclaim on March 31 with a tight intraday stop, trimmed 15% two days later at +3R to +5R to finance the stop, and then rode the remaining 85% core for 26 trading days along the rising 9 EMA until May 7 for +57.0% (+25R).
-
Similarly, when he broke this rule on Super Micro Computer (SMCI) and sold his core into early strength instead of waiting for a daily close below the 9 EMA, the stock ran another 200%+ without him. He graded that single premature exit as a 40R+ mistake.
Six Mentors He Borrowed Ideas From
Just like Qullamaggie, Luk didn't invent any secret indicator or something new. He borrowed ideas, and synthesized six concepts from others. And equally important: he adapted these concepts and stripped away everything that slowed him down:
-
Jay Law (@jlawstock): Luk was introduced to momentum trading and the US market in a two-day in-person seminar in Hong Kong in February 2023. JLaw inspired him to enter the USIC.
-
Kristjan Kullamägi (@Qullamaggie): Hundreds of hours of archived Twitch streams studying Episodic Pivots, high-tight flags, and trailing monsters on daily moving averages ("Qullamaggie was my biggest mentor").
-
Mark Minervini (@markminervini): Stage 2 trend templates, volatility contraction, and progressive exposure.
-
Brian Shannon (@alphatrends): Anchored VWAP from catalyst days, swing highs, and swing lows to pinpoint institutional support and resistance on 1-minute and 5-minute charts.
-
Pradeep Bonde (@PradeepBonde / Stockbee): Episodic Pivot catalysts, momentum bursts, and market breadth situational awareness.
-
Stan Weinstein (@StanWeinstein) Stage analysis across sectors
And he also attributes @jaredtendler for introducing him to the inch-worm concept and The Mental Game of Trading to map out his A-game, B-game, and C-game and stop tilt spirals before they snowball.
Because he was taking full-time university classes during the day in Hong Kong and trading the US market from 9:30 PM to 4:00 AM local time, he compressed his entire daily prep into 30 minutes before the open.
So, there's really no excuse not to make trading work!
The Psychology Behind This: It's Not For Everyone
+969.8% yearly returns, with very small drawdowns. On paper this seems effortless. Easy even. But in reality it's brutal.
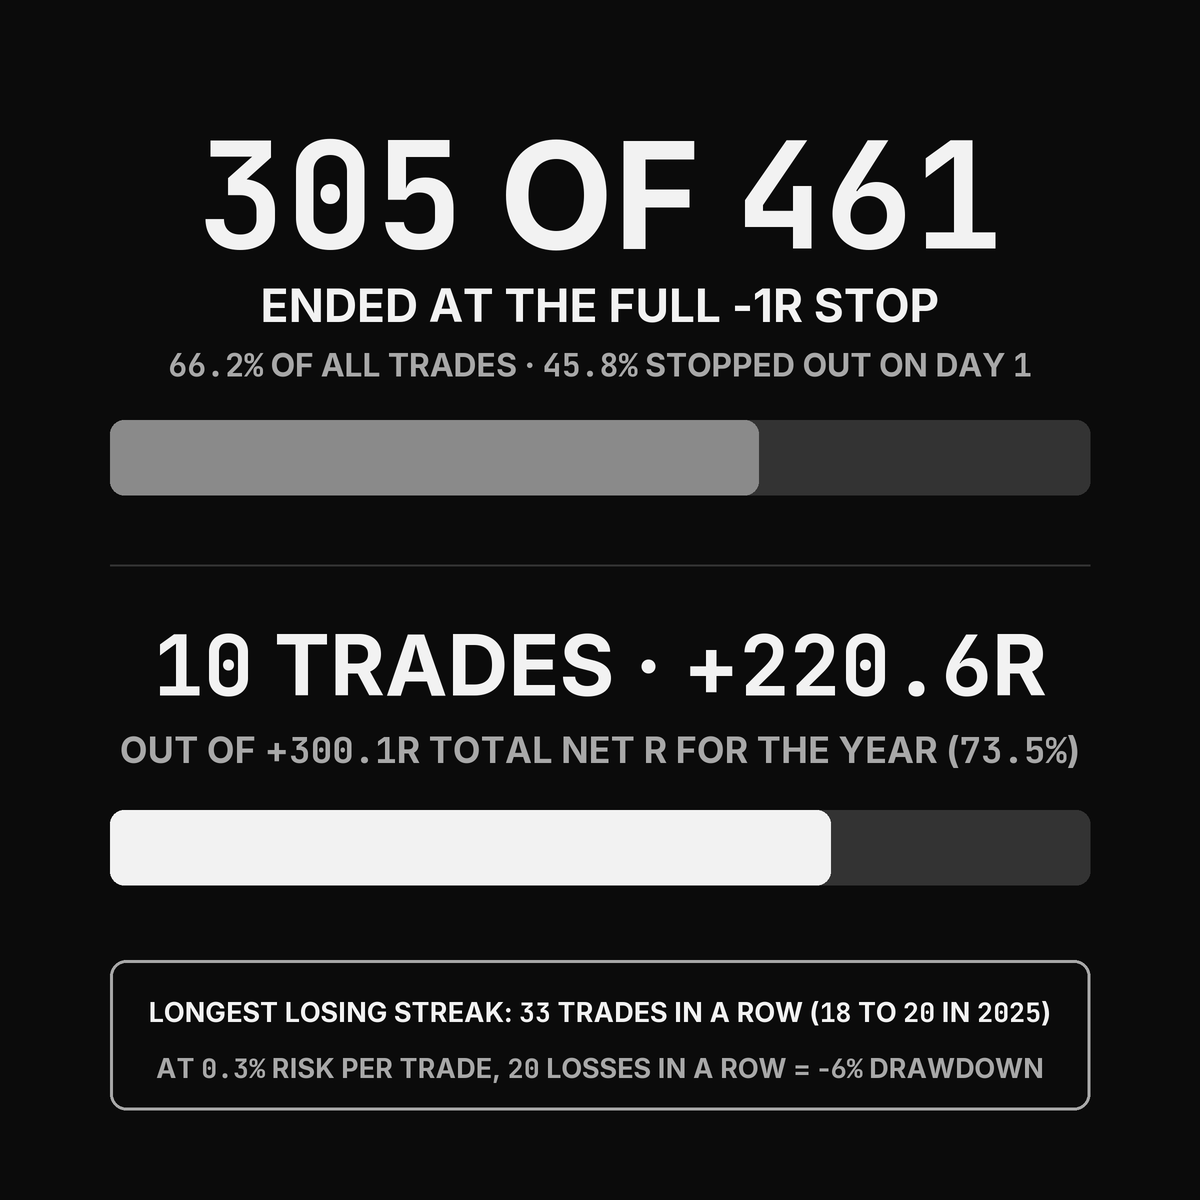
10 trades making up almost 75% of the yearly gains
-
305 out of 461 trades ended at the full -1R stop.
-
211 of those trades - almost half his trades - stopped out on Day 1.
-
His longest losing streak in my 2026 dataset was 33 losing trades in a row. He talked about an 18 to 20 trade losing streak live on stream in November 2025.
-
Just 10 trades generated +220R out of his +300R total net R
Even for Luk, the mental difficulty is real. By November 2025, his USIC account was up +1,358.2% YTD. Then came December 2025: a choppy, trendless tape where he forced 74 trades, won only 9 of them (12.2% win rate), and suffered a -26.6% monthly drawdown that made his final 2025 return +969.8%.
When he reviewed those 74 December trades in his year-end review, he found that 46% of them were "random trades", flipping long and short on intraday noise out of boredom and frustration. Worse, the mental exhaustion from those 74 chop trades caused him to hesitate and miss the massive A+ breakout in SanDisk (SNDK) right after.
And here lies the real lesson: Because he risks 0.3% to 0.5% per trade (or even less when his pnl says so), a normal 20-trade losing streak only costs -6% to -10% of equity. You only need one winner to finance this.
Liked this article and want more? Let me know.
I will be sharing a full 45min+ Masterclass video next week.
‼️If you want to study all of his trades they will be available on app.qullamaggiedeepdive.com soon™