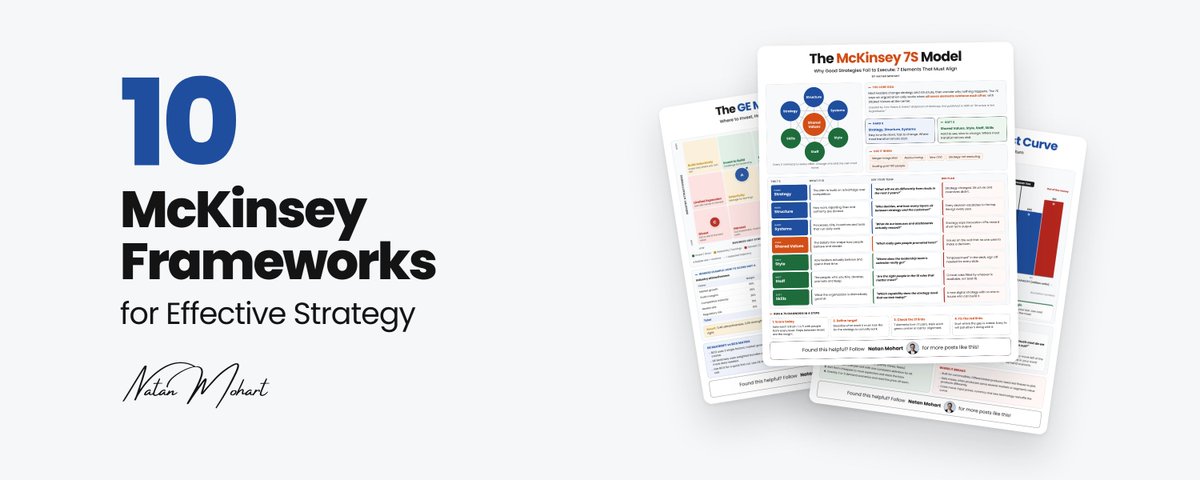
10 McKinsey Frameworks for Effective Strategy
文章目录
Every strategy book I've read mentions McKinsey frameworks. Almost none of them shows how to run one with your team on a Monday morning.
So I started turning them into one-page infographics. After drawing all ten, my honest take is this: most of them are simpler than consultants make them look, and most teams use them badly. They fill in the boxes, put the slide in a deck and never decide anything with it.
For each framework I kept only what helps you make a decision: when to pull it out, the steps to run it, the one question that starts the right argument, and the mistakes that quietly kill it.
Here are the first three. The other seven are on my Substack (link at the end).
Bookmark this. You'll want it the next time someone in a meeting says "we need a strategy."
1. The McKinsey 7S Model
Real story: IBM, 1993
When Lou Gerstner took over IBM in 1993, it was heading for a loss of about $8 billion, and the plan on his desk was to break it into independent companies. He kept it whole and went after the culture instead: divisions fought each other and customers came last. He changed pay, decision-making and how leaders spent their time around one goal, solving the customer's problem. He later wrote that culture "is the game." He fixed the soft S's first, and the hard ones followed.
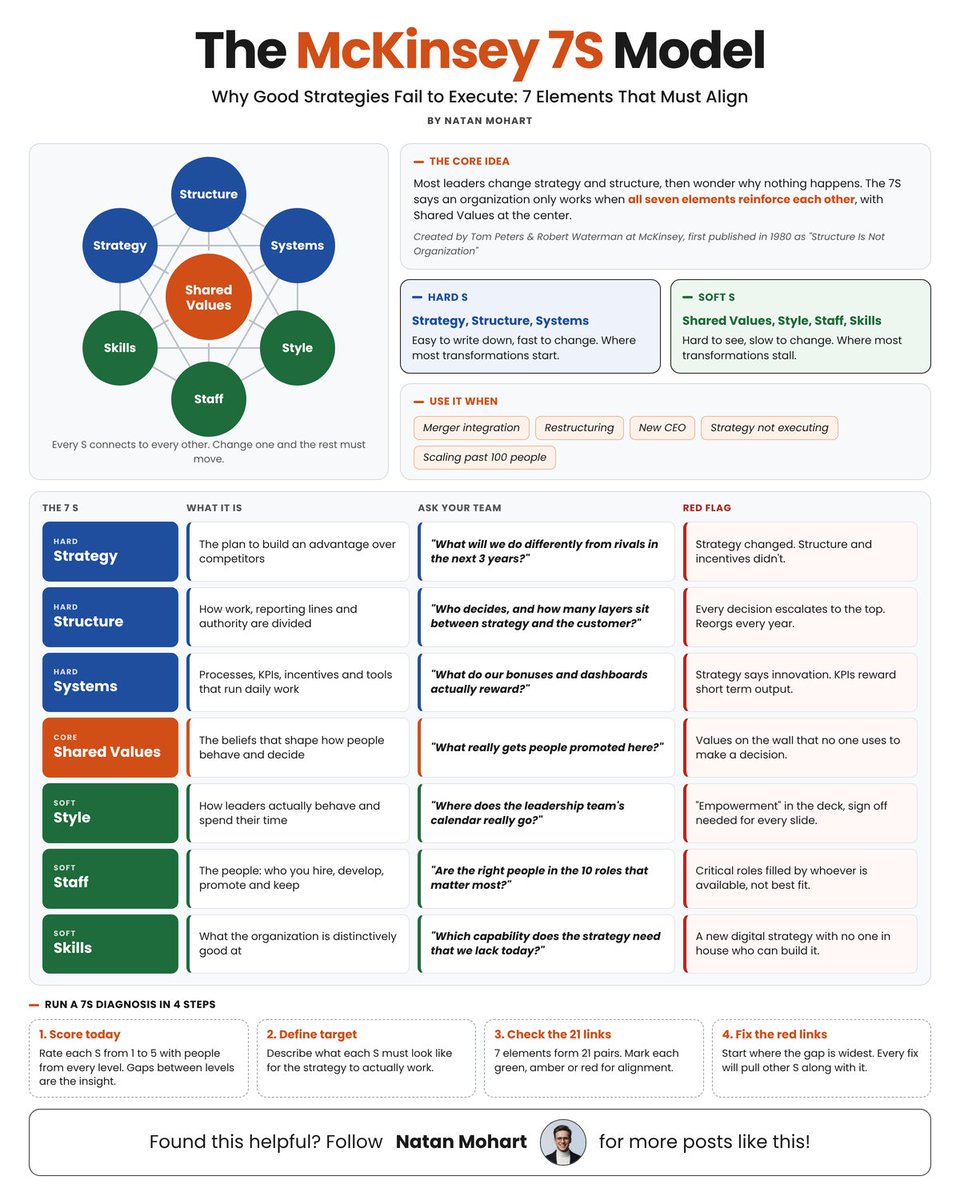
Tom Peters and Robert Waterman built the 7S at McKinsey and first published it in 1980 in a paper called "Structure Is Not Organization." Their point was simple. Leaders change the strategy and redraw the org chart, then wonder why behavior stays the same.
The model splits an organization into seven elements. Three are "hard": strategy, structure and systems. You can write them down and change them in a quarter. Four are "soft": shared values, style, staff and skills. They're harder to see and they take years to move. Shared values sit in the middle because they hold the rest together.
Ask your team: "What really gets people promoted here?"
When to use it
After a merger, during a restructuring, when a new CEO arrives, when the company grows past about 100 people, or when a strategy has been approved for a year and nothing has happened.
How to use it
-
Score today. Ask people from every level to rate each S from 1 to 5. The gaps between levels tell you more than the scores do.
-
Define the target. Describe what each S has to look like for the strategy to actually work.
-
Check the 21 links. The seven elements form 21 pairs. Mark each pair green, amber or red for how well the two support each other.
-
Fix the red links. Start where the gap is widest. Each fix pulls the other S's along with it.
Common mistakes
-
Changing only strategy and structure because they're the easiest to change, and leaving incentives and leadership behavior as they were.
-
Running the diagnosis with the leadership team only. The view from the top is usually the most optimistic one.
-
Treating shared values as a poster. If nobody uses them to make a decision, they don't count.
2. The GE-McKinsey Matrix
Real story: General Electric, 1981
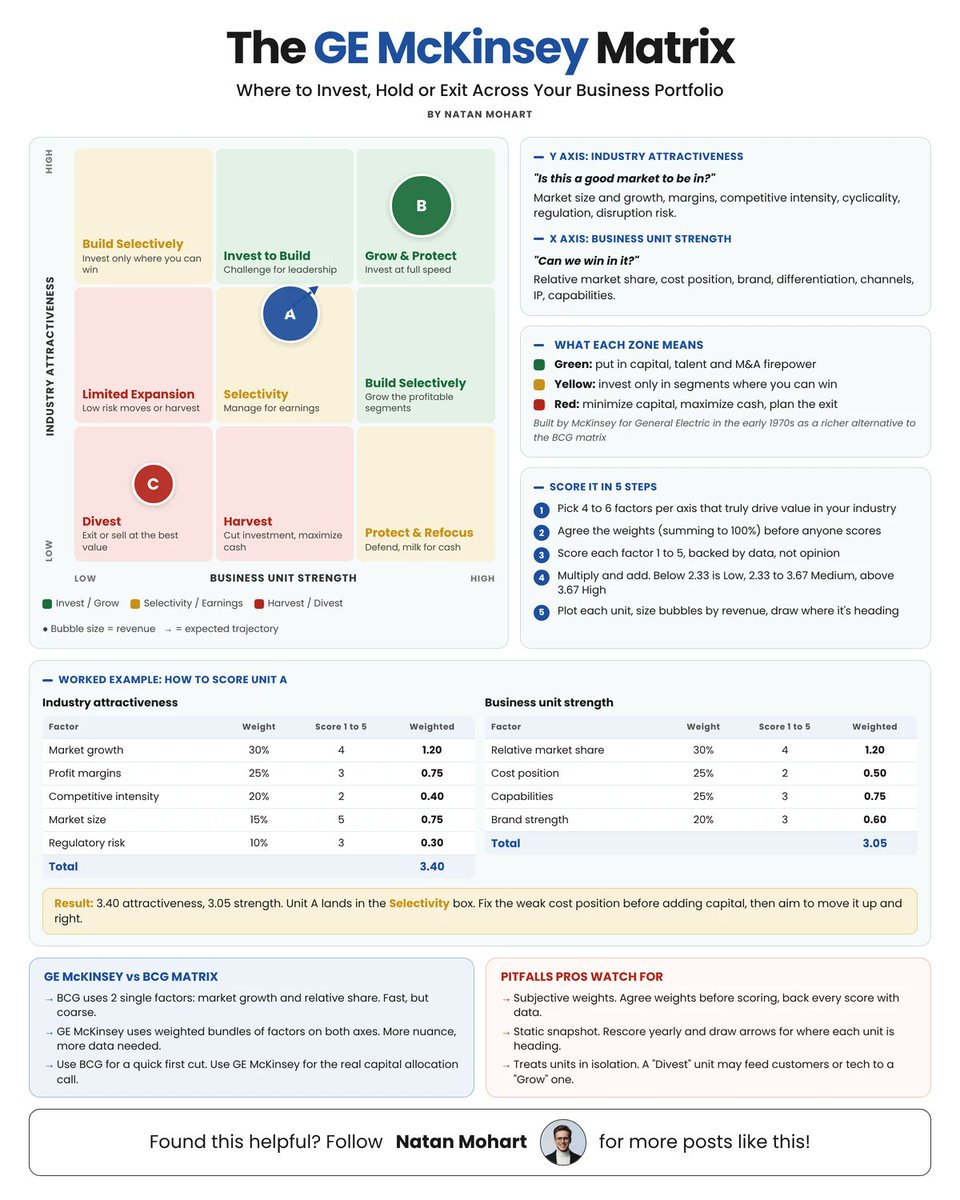
When Jack Welch became GE's CEO in 1981, he gave every business one rule: be number one or number two in your market, or be fixed, sold or closed. GE sold units that couldn't lead, including small appliances in 1984, and put the money into the ones that could. That's the matrix in one sentence: invest where the market is attractive and you can win, and get out where you can't.
McKinsey built this nine-box grid for General Electric in the early 1970s. GE had dozens of businesses competing for the same capital, and the BCG matrix (two factors, four boxes) was too blunt for that call.
The vertical axis asks whether the market is worth being in: size, growth, margins, competitive intensity, regulation. The horizontal axis asks whether you can win in it: market share, cost position, brand, capabilities. Each axis is a weighted score, so you choose the factors that matter in your industry.
Green boxes get capital, talent and M&A budget. Yellow boxes get investment only in the segments where you can win. Red boxes get managed for cash or sold.
The infographic includes a worked example. Unit A scores 3.40 on attractiveness and 3.05 on strength, which puts it in the middle box. The weakest factor is cost position (2 out of 5), so that's what to fix before adding capital.
Ask your team: "Is this a good market to be in, and can we win in it?"
When to use it
When you run several business units or product lines and have to decide where capital goes: the annual portfolio review, budget season, or before buying or selling a unit.
How to use it
-
Pick the factors. Choose 4 to 6 per axis that actually drive value in your industry.
-
Agree the weights first. They must add up to 100%, and nobody scores until they're fixed.
-
Score each factor from 1 to 5, backed by data, not opinion.
-
Multiply and add. Below 2.33 is low, 2.33 to 3.67 is medium, above 3.67 is high.
-
Plot each unit. Size the bubble by revenue and draw an arrow to where it's heading.
Common mistakes
-
Arguing about weights after the scores are in. That's how people steer the result toward the unit they like.
-
Treating the matrix as a one-time snapshot. Rescore every year and track the arrows.
-
Judging units in isolation. A "divest" unit sometimes supplies the customers or technology a "grow" unit depends on.
3. Three Horizons of Growth
Real story: Kodak, 1975
In 1975 Kodak engineer Steve Sasson built the first digital camera. He later recalled the reaction inside the company as roughly: that's cute, but don't tell anyone. Film had huge margins, and every dollar spent on digital would have come out of the core. Kodak never let its H3 option grow into H2, and it filed for bankruptcy in 2012.
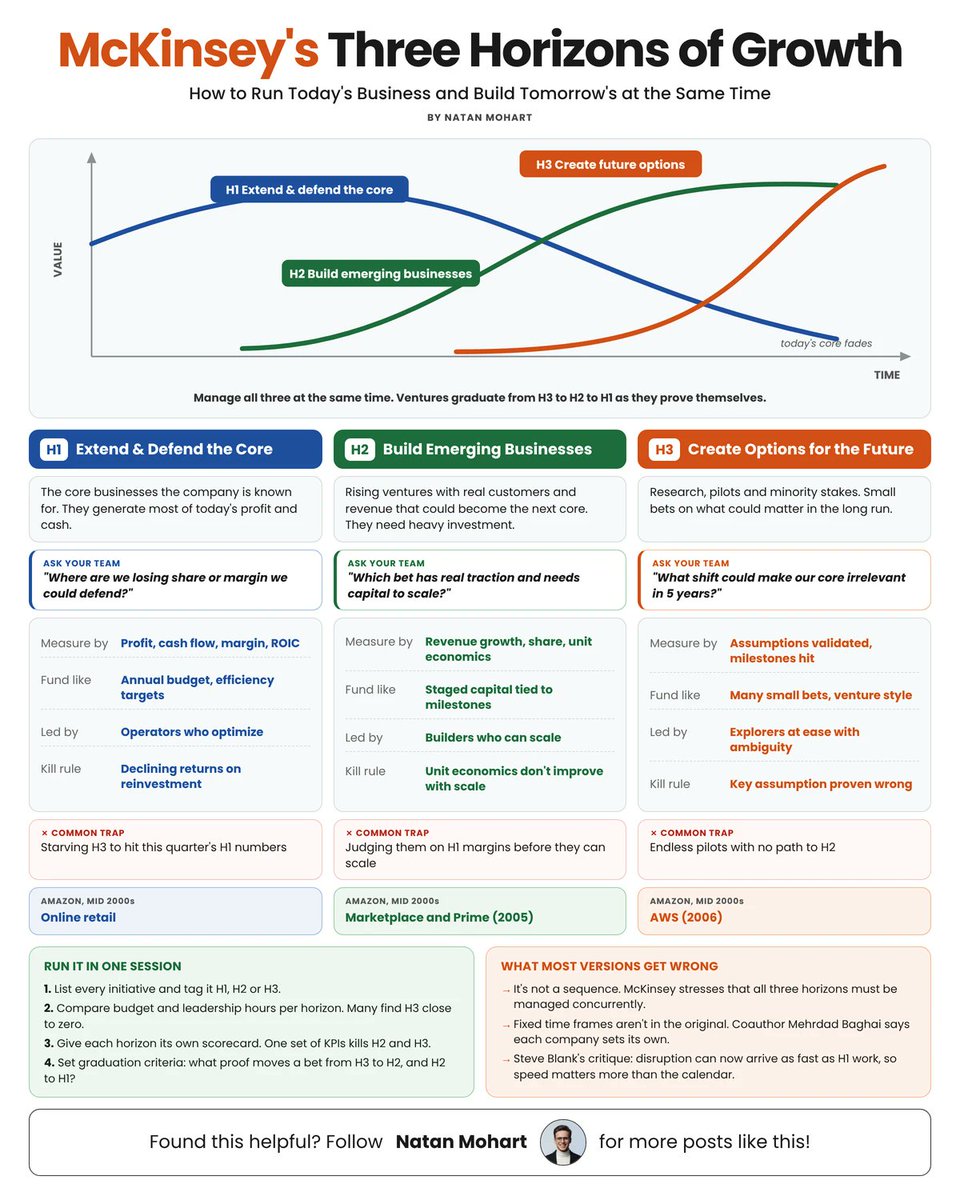
Mehrdad Baghai, Stephen Coley and David White introduced the Three Horizons in The Alchemy of Growth (1999). It's about running today's business and building the next one at the same time.
Horizon 1 is the core: the businesses that make most of today's profit. Horizon 2 is emerging businesses with real customers that could become the next core. Horizon 3 is research, pilots and small stakes in ideas that might matter in five or ten years.
Amazon is the standard example. Online retail was H1. Third-party Marketplace (launched in 2000) and Prime (2005) were H2. AWS, launched in 2006, was H3, and it later became the most profitable part of the company.
Ask your team: "What shift could make our core irrelevant in 5 years?"
When to use it
During annual planning, when growth in the core is slowing, or when the innovation budget gets cut every time the quarter looks tight.
How to use it
-
Tag everything. List every initiative and mark it H1, H2 or H3.
-
Count the resources. Add up the budget and leadership hours per horizon. Many teams find H3 close to zero.
-
Give each horizon its own scorecard. One set of KPIs for all three will kill H2 and H3.
-
Set graduation criteria. Decide what proof moves a bet from H3 to H2, and from H2 to H1.
Common mistakes
-
Treating the horizons as a sequence. All three run at once.
-
Using fixed timeframes. The original book doesn't set them; each company sets its own. Steve Blank has also argued that disruption now arrives faster than the model assumes.
-
Starving H3 to hit this quarter's H1 numbers, or running endless H3 pilots with no path to H2.
The other 7 are where it gets interesting
The first three help you run the company you have. The next seven help you see what's coming: price wars, takeovers, and customers you're losing without knowing it.
Each one has its own infographic, a real story and the steps to run it:
-
Business System. Rivals spent years copying Southwest. Why did every copy fold?
-
Industry Cost Curve. In 2014 OPEC chose not to cut output, and oil fell from $110 to under $30. Who was it aiming at, and how do you tell if you're next?
-
Consumer Decision Journey. In 2009 US car sales fell by a fifth. Hyundai's grew, thanks to one promise almost nobody used.
-
Influence Model. Alcoa's new CEO told investors he would focus on worker safety. By the time he left, profit was about five times higher.
-
SCP Framework. How US airlines went from price wars to four giants, and what that says about your industry.
-
Strategic Control Map. AOL bought Time Warner with "expensive" stock. Two years later came a $99 billion loss. Are you the hunter or the hunted?
-
Portfolio of Initiatives. Netflix bet the company on streaming only after one thing was true. Most companies skip it.
Plus a short map of how all ten fit together, so you know which one to pull out first.
Read all 10 for free on Substack: natanmohart.substack.com/p/mckinsey-frameworks
Subscribe there and the next breakdown lands in your inbox.