pricing GPU compute 101

文章目录
Aristotle tells of Thales of Miletus who placed one of the oldest trades on record which was a reservation on machine time. He had expected a large olive harvest and in the winter months he paid small deposits to hire every olive press in Miletus and Chios. When the harvest came and everyone needed a press at once, he let them out at his own price (pretty cool alpha I must say). He forecast the crop but bought time on the presses. Aristotle told it as a story about monopoly; it is often called the first option.
GPU-hours are the olive presses of this decade, and they are now quoted every day. At least four firms publish daily rental indexes. Four exchanges have announced compute futures. A US regulator has just closed a public consultation on how to list them. Yet most engineers who rent GPUs have never seen the price built up from its parts. I wanted to write a piece which helps the average dude price a GPU hour from what it costs to make, then from what the market pays, then follows the ripple effects that move the gap between the two.
Three things to note to get started
1. One chip family trades on cost; the next trades on scarcity.
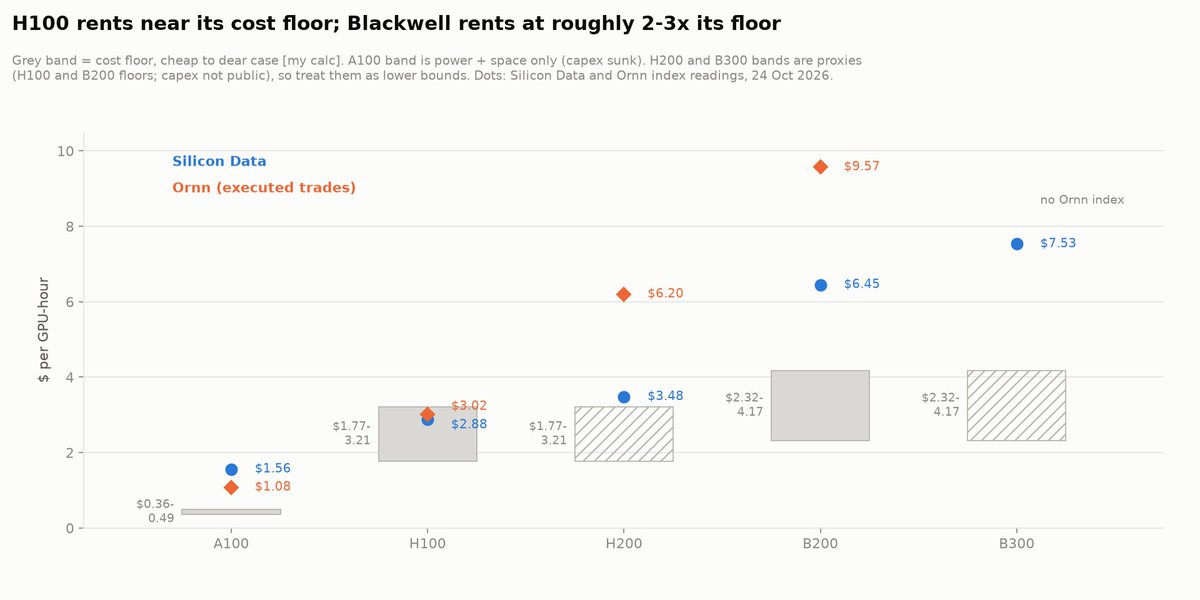
On 24 Oct an H100 rented for $2.88 an hour on Silicon Data's index and $3.02 on Ornn's. My cost floor for an H100 is $1.77 to $3.21. So on both rental-based indexes, H100 sits at about its cost. A B200 rented for $6.45 to $9.57 against a floor of $2.32 to $4.17, mid case $2.90. Blackwell trades at roughly 2 to 3 times its floor, depending on which index you read. The price is the higher of two things: the cost floor, or a scarcity premium set by a few factors like the queue for memory, packaging and power.
2. Money sets the floor, not plain electricity wattage. Capital is about 70% of a GPU-hour. Electricity is under 10%. The swing factors are how long you assume the chip earns, how full you keep it, and what your debt costs. Power matters through timing: it decides when new supply can switch on. That makes the credit market part of the compute supply curve. On 15 Oct, CoreWeave's five-year credit default swap priced a better-than-60% chance of default within five years, and I am sure Michael Burry is rushing to get default swaps on these dudes.
3. Compute cannot be stored, so it trades lowkey like power, and the hard part is basis. You cannot buy an hour today and sell it next month. On the same day, for the same chip, the main indexes disagree by up to 78%. That gap is bigger than most monthly price moves, so a basis trade on compute is as good as a prediction market on trump’s next move.
The cost floor: what an hour costs to make
What’s a cost floor?? Think of a taxi: the car loan, the fuel and the parking, divided by the hours a passenger is actually in the back seat.
Start with one formula. The floor is the price at which the owner of a GPU just breaks even:
floor per GPU-hour = (capital + power + space per year) ÷ (8,760 hours × occupancy)
-
Capital is the purchase price spread over the chip's life at your cost of money. It works like a mortgage payment. Finance people call the multiplier the capital recovery factor.
-
Power is the GPU's draw, times the building's overhead (PUE, power usage effectiveness: total facility power over IT power), times hours, times the electricity price.
-
Space is colocation rent, charged per kilowatt per month.
-
Occupancy is the share of hours someone actually pays for. An empty hour is gone forever.
I priced three cases for each chip: cheap, mid and dear. Inputs come from filings and official data where they exist. An 8-GPU DGX H100 draws up to 10.2 kW and a DGX B200 up to 14.3 kW. US industrial power cost 8.71 cents per kWh in May 2026. Colocation in Northern Virginia and Chicago ran about $190 to $235 per kW-month. The average data centre PUE was 1.54 in 2025; Epoch AI cites 1.14 as the 2023 average for specialised AI facilities. Server prices are the weakest input. They come from vendor estimates, and I checked them out against Epoch AI's cluster-cost multiplier.
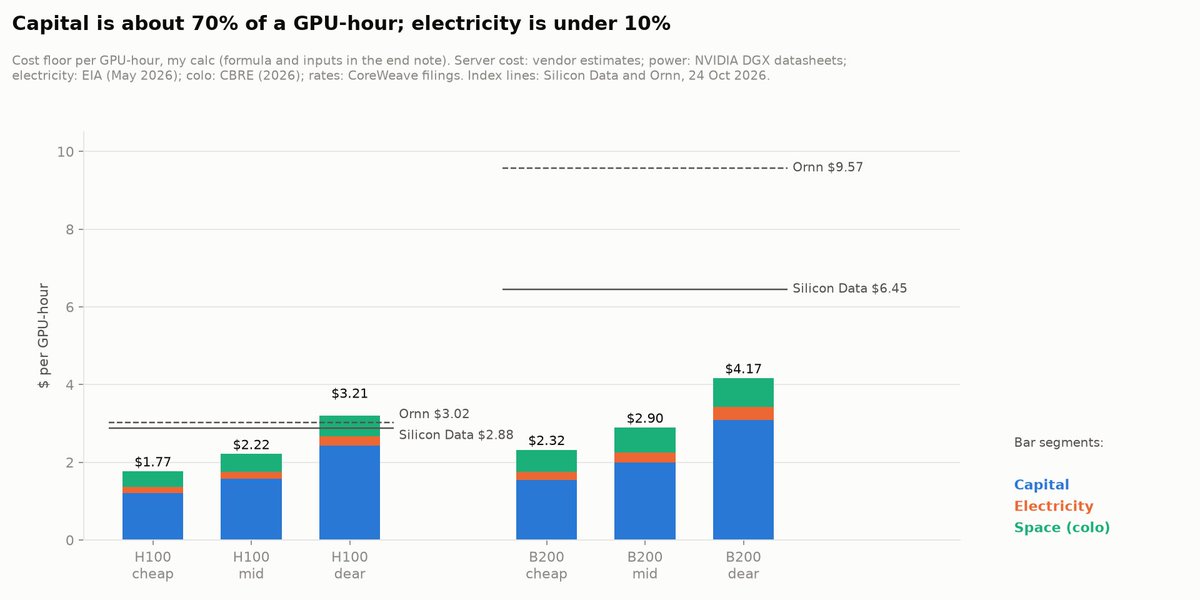
Cost-floor stacked bars for H100 and B200
The result: an H100 costs $1.77 to $3.21 an hour to provide, and a B200 $2.32 to $4.17. Four things stand out.
Capital dominates. In the mid case it is about 70% of the hour for both chips. Electricity is 8 to 9%. Double the power price and the B200 floor rises only 9%. Kalshi put out a split putting power and cooling higher, at about 16% of the price, but didn’t reveal the inputs.
Assuming GPU life is weird game. Filed depreciation lives run from four to six years. CoreWeave uses six, Meta 5.5, and Amazon cut a subset of servers from six to five. Nebius used four years and is moving to five in 2026. Real service lives can be longer: Microsoft retired its K80 cloud machines about seven years after launch and its V100s after about seven and a half. Moving an H100 from a six-year to a four-year life lifts its floor 26%, so a lot is dependent on a company deciding how long a specific GPU can provide value.
Occupancy is a hotel problem. At 80% occupancy the B200 floor is $2.90. At 60% it is $3.86, up 33% which basically means losing 20-ish points costs more than gaining 20 saves.
The cost of debt matters, but less than you would guess on its own. Moving the rate from 9.25% to 15% lifts the H100 mid floor 11%. The full move from the cheap to the dear case (+81%) comes from rate, life and occupancy together. Lenders move all three underlyings at once: when credit tightens, they also demand shorter payback and question utilisation.
For a chip whose purchase is already paid off, the floor collapses. An A100 owner only needs power and space, about $0.36 to $0.49 an hour. Anything above that pays back old capital. That is why old chips can keep renting cheaply for years.
My personal understading is: the way models and compute are progressing, as of today demand outdoes supply causing bidirectional moves in pricing but going forward old GPUs can be used to run older models or provide a cheaper option to run the same models but at slower tok/s. I just think we are under-assuming the lifecycle of a GPU and it can provide more value if we stop looking at only frontier models and labs, making better $ usage for retail trying to consume the tail end of compute.
cost per million tokens = GPU-hour price ÷ (million tokens per GPU-hour × (1 − share held back for bursts) × utilisation)
Ornn's version holds back 15% and assumes 50% utilisation. On its 1 Sep prices, Llama-2-70B came to about $0.68 per million output tokens on an H100. For the open model gpt-oss-120b, an H100 needed 53% utilisation to match the $0.60 median hosted price, and an A100 only 24%.
Every input in that line is a risk you can hedge or not: the hour price, the model's throughput, and how busy you keep the chip.
The market price: four ways to buy, indexes that disagree
The floor tells you where sellers stop. The market tells you what buyers pay. Compute is sold four ways, as a GPU provider set out in its comment to the CFTC:
-
Committed: multi-year take-or-pay contracts for whole clusters. Confidential. By far the largest by value.
-
Reserved: 1 to 12 months at a fixed rate, partly prepaid. Bilateral and unpublished.
-
On-demand: hourly, posted, cancellable. Small by value but fully visible.
-
Spot: cheaper, and the provider can reclaim it.
Price discovery happens in the smallest, most visible slice.
At least four firms turn that slice into a daily number. Compute Desk's values are not public, so this piece compares the other three. Each uses a different method, so each gives a different price:
-
Ornn averages executed on-demand trades, weighted by volume (Ornn).
-
Silicon Data standardises rental observations from neo-clouds and marketplaces to one benchmark spec. It does not say these are executed trades (Silicon Data). CME's proposed futures would settle on it.
-
Price of Compute takes a median of posted on-demand prices: first within each provider, then across providers, from 12 tracked providers (methodology).
Floor vs market price by chip
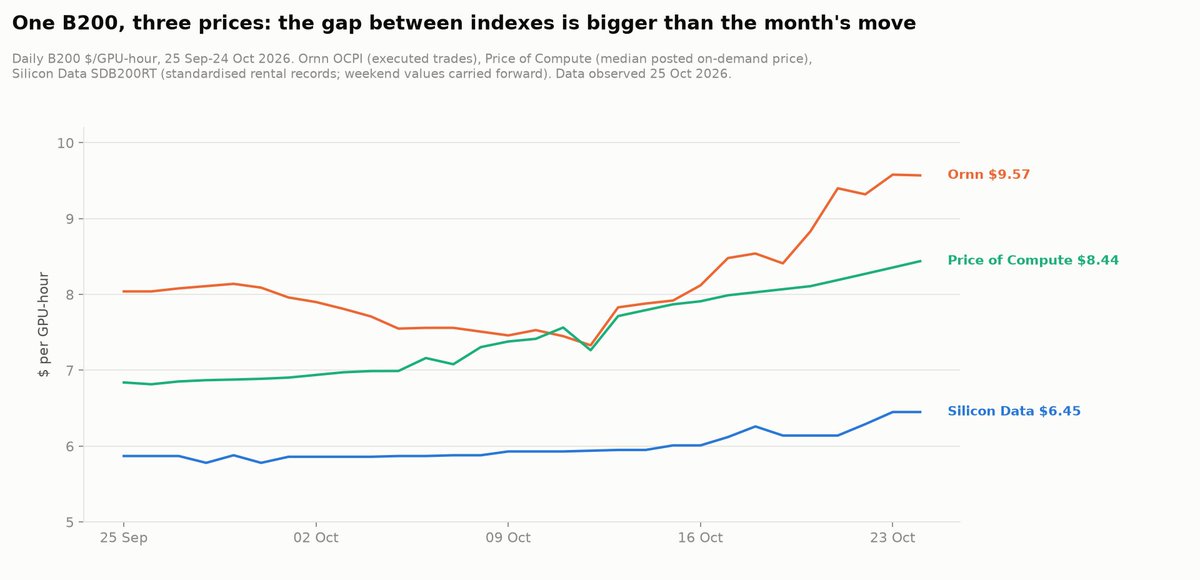
On 24 Oct, Silicon Data and Ornn read $3.48 vs $6.20 for H200 and $1.56 vs $1.08 for A100, on top of the H100 and B200 readings in the findings. Price of Compute's posted median sat between them for H200 and B200 and above both for H100 and A100. On 15 Oct, B300 read $6.77 on Silicon Data and $8.26 on Price of Compute, a pretty big 22% gap.
(pls dont average these) Each answers a different question. Posted prices are the top of the market: on 25 Oct, named providers listed H100 on-demand at $3.99 to $4.50, and CoreWeave at about $6.16. The big clouds are a different market again. Silicon Data's H100 hyperscaler reading was $7.17, 2.5 times its neo-cloud reading, and it barely moved all month.
All of them rose this year. Silicon Data's H100 went from $2.00 on to $2.88, up 44%. On Ornn, newer chips rose roughly 70 to 110% from March to September and A100 about 20%. Nebius lists on-demand H100 at $4.50, reportedly up from $3.85 on 1 Oct. A market trading at cost does not do that. A market rationing a queue does.
I like my women like i like my GPU forward pricing, with curves
A forward curve lists today's price for compute delivered at future dates. Ornn's analysts build one from active deals. Every family slopes down: a five-year H100 contract prices at 60% of the one-month rate, H200 at 44%, A100 at 80%. Together AI's posted ladder shows the same shape over months: its H100 for 91 to 180 days costs 80% of on-demand.
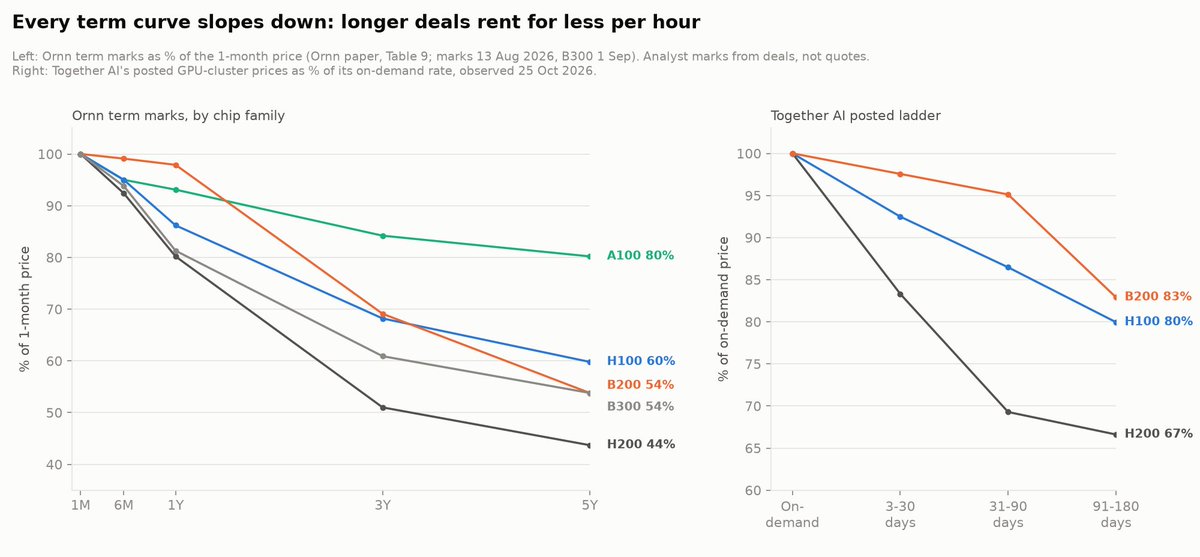
Traders call a downward slope backwardation. Here it has three causes: a) Buyers expect the next chip generation to cut prices b) Providers accept less per hour for committed revenue, because lenders finance against it. c) natural hedgers mob to one side: providers want to sell forward, so whoever buys from them gets paid for taking the risk.
A100's curve is the flattest, for the sunk-capital reason i put up in section 1. The newest chips fall fastest at the long end, because they have the most scarcity premium to lose.
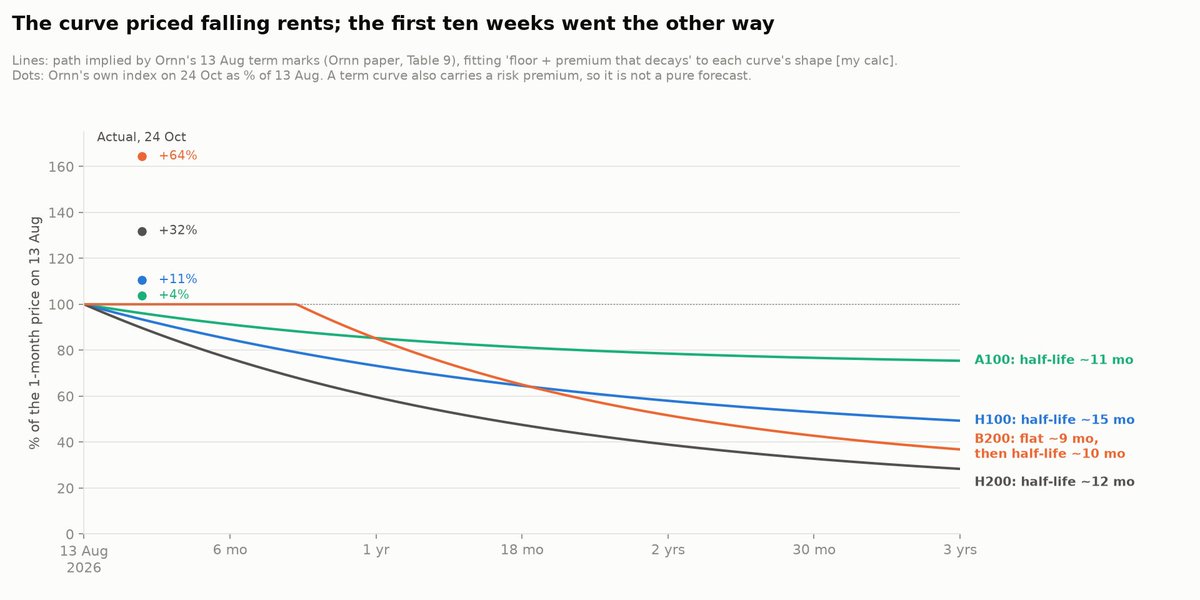
A downward curve reads like a forecast of falling prices, so it can be scored. Fit "floor plus a premium that decays" to the shape of each Ornn curve and you get the path it implies. From the 13 Aug marks, that path had H100 about 6% cheaper by 24 Oct, H200 10% and B200 5%. On Ornn's own index, H100 rose 11%, H200 32% and B200 64% (my math so dont trust it). Kalshi's market-implied curve from July had a different shape: A100, H100 and H200 roughly flat through 2027, and B200 falling from about $7.20 to about $5.50 over a year. The two curves disagree on which chips lose their premium first. Both had B200 falling; on 24 Oct Ornn's B200 index read $9.57. A GPU provider publicly disputed the "rents fall over a chip's life" assumption. Treat the curve as a price of risk, not a firm prediction.
There exists a way to hold both facts: spot = floor + scarcity premium. The floor drifts down slowly as chips get cheaper and lives get longer. The premium jumps on random headlines and supply news, then decays as new capacity arrives. Energy traders often model power prices the same way, as a slow trend plus jumps that fade. The curve's slope is the market's bet on how fast the premium decays, and the same fit puts a number on it. For all the popular GPUs, the curves imply the premium halves every 11 to 15 months. B200's curve stays almost flat for a year, so its best fit holds the premium for about nine months, to around May 2027, then halves it every ten months. In 2026 the premium decayed slower than priced. My read is that packaging, memory and power kept new supply late (or it could be a strategic big tech move who knows).
A question I also saw was why compute trades like power, not oil. Oil can be stored, so a future equals spot plus the cost of carrying a barrel. That is cash-and-carry arbitrage. Electricity cannot be stored, so nothing ties the forward to spot. The standard model, from Bessembinder and Lemmon (2002), says power forwards are set by hedging demand: the premium rises with expected demand and demand risk, tied to sudden spikes in spot. A GPU-hour is the same kind of good. Power markets also explain the contract design below: monthly averages and location zones.

The risks a hedger actually faces:
-
Basis. your GPU is not the index GPU. Interconnect, cluster size, region, uptime and term all change the price. Lambda's two-week-to-one-year H100 clusters list at $5.54 to $6.16 an hour, above its $3.99 on-demand instances. A cluster is a different product from a single machine, even with the same chip. That gap between what a contract pays on and what your workload needs is called basis.
-
Index choice. Over the 30 days to 24 Oct, B200 rose 9.9% on Silicon Data and 19.5% on Ornn. The gap between the two on 24 Oct was 48%.
-
Thin data. Price of Compute's B300 is a median of three providers, with listed prices from $6 to $15 on 25 Oct.
-
Headlines. Export approvals and model releases move prices in days, then the move fades.
-
Counterparty. A reservation is only as good as the provider. CoreWeave's CDS hit about 1,195 basis points on 15 Oct. It carried about $35.1B of debt at 30 June.
Same chip, three indexes, one month
do you all remember the 2000 bandwidth bust (i dont i was born in 04’). Enron made its first bandwidth trade in December 1999: a monthly contract for a DS-3 circuit between New York and Los Angeles, which it used as a benchmark price. It was also building "pooling points" where traded capacity would be delivered. Two years later the trade press called bandwidth "a lousy business”, and energy traders soon quit the market. The usual explanations: no standard deliverable, too few delivery points, carriers unwilling to sign firm contracts, failing counterparty credit and a glut of fibre. Compute markets face the first four questions today. The fifth is the one bulls often like to shun away.
Following the GPU
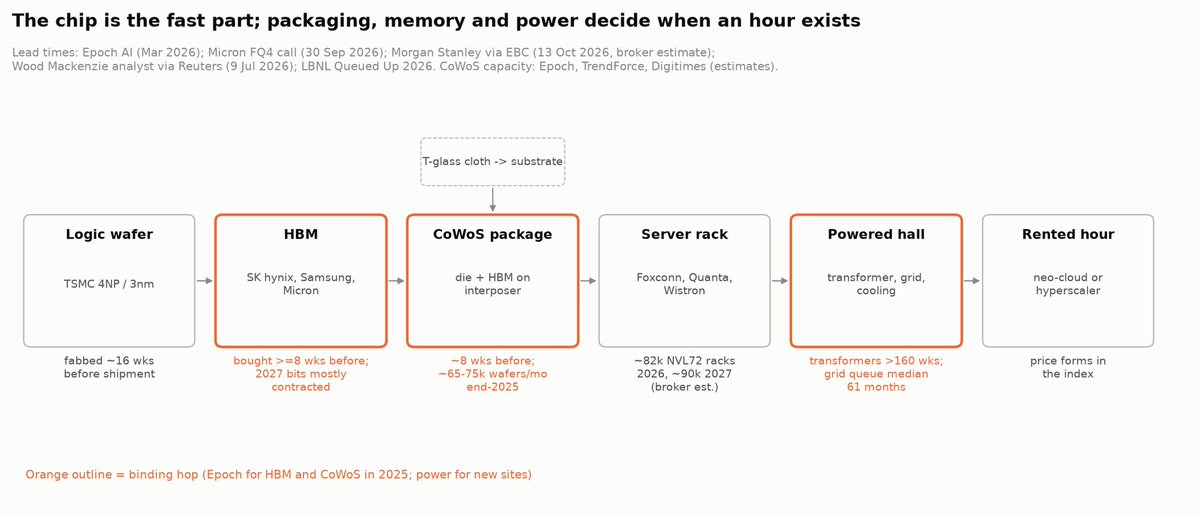
A rented hour exists only when every link in a chain is done. Go-live is the latest of three dates: chips delivered, building ready, power connected. A fast hop is worth nothing if it is not the last one.
Following the GPU chain
The chip is the fast part. Logic wafers are made about 16 weeks before a GPU ships; HBM is bought at least 8 weeks before and CoWoS packaging (the step that bonds chip and memory) about 8 weeks before. In 2025, HBM and CoWoS were the binding constraints, not wafers.
Memory is sold out ahead. Micron said on 30 Sep that it had agreements for the "vast majority" of its 2027 HBM supply, at significantly higher prices.
Power is the slow part. Generator step-up transformers took more than 160 weeks to deliver by early 2026, a Wood Mackenzie analyst told Reuters. Power plants finished in 2025 took a median of more than five years from grid request to operation. So power is staggering due to structural constraints while everyone is pushing chips like there’s no tomorrow.
A note from somewhere in Taiwan. T-glass. A low-expansion glass cloth goes into the substrates under CoWoS packages. One Japanese maker, Nittobo, dominates. It plans to triple capacity by the fiscal year to March 2029, and its president says "even this expansion will not be enough". A minor material can cap a package worth tens of thousands of dollars ~ worth looking into.
What moves the curve
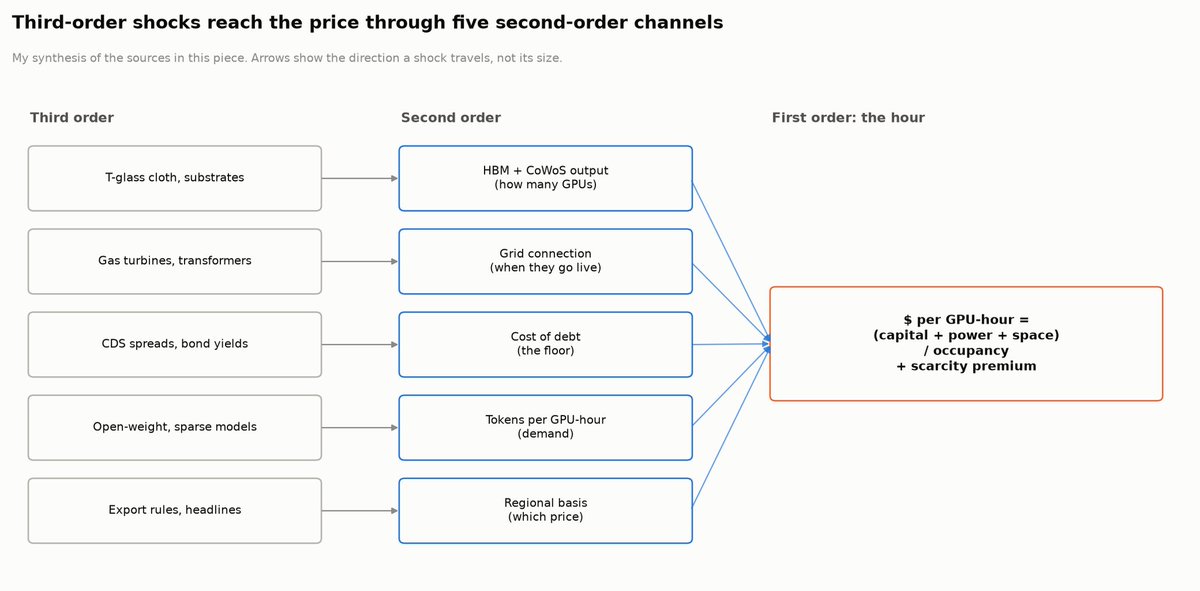
Each driver works through one of five channels. Memory and packaging set quantity. Power sets timing. Credit sets the floor. Model efficiency sets demand. Export rules and location set which price you pay.
Driver map: first, second and third order
Memory and packaging decide how many GPUs exist. Epoch AI estimates a B200 costs about $6,400 to make (range $5,700-$7,300). HBM is $2,900 of that, and packaging $1,100 plus $1,000 of yield loss. A 30% jump in HBM prices would add about $870 per GPU, lifting the B200 floor by about 1%. But if HBM or CoWoS is short, the GPU is never built. Memory changes the number of hours far more than the cost of each.
Power decides when. PJM, the largest US grid, cleared its capacity auction at the price cap for the third time in a row in July. In the previous auction, data centres made up 5,100 MW of the 5,250 MW rise in forecast peak load for 2027/28. In primary North American markets, 80% of capacity under construction is already committed making it the deciding factor of when the curve's long end gets new supply.
Power is a small cost on average but not in the tail. Kalshi frames a data centre's margin the way power traders frame a gas plant's: the compute price minus the power it burns, which it calls the Silicon Spark Spread. An H100 uses about 1.7 kWh per hour including cooling, about 14 cents at US industrial rates. But Texas lets wholesale power reach $5,000 per MWh in scarcity hours. Above about $1,700 per MWh, an H100 renting at $2.88 earns less than its power costs; for a B200 at $6.45 the line is about $2,800 (my calc). Most operators buy power at fixed rates, so this hits only those exposed to wholesale prices.
Credit: the floor, and a loop. CoreWeave's GPU-backed loans range from SOFR + 2.25% on a 2026 facility to SOFR + 13%. Inside one older facility, the spread was 6 to 6.5 points for contracts with investment-grade customers and 13 points for the rest. The cost of capital depends on the customer as much as the borrower. That creates a third-order loop: wider credit spreads raise the floor, which slows new building, which raises future spot. My favourite realization was that a credit shock is bullish for rents in the medium term and bearish for anyone who must refinance a fleet.
Model efficiency raises demand. The cost of running a model at GPT-3.5 level fell more than 280-fold from late 2022 to late 2024. Demand rose faster: Google now processes over 3.2 quadrillion tokens a month, up 7 times in a year, famously parallel to the Jevons paradox after William Stanley Jevons, who argued in 1865 that more efficient steam engines would raise Britain's coal use. Efficiency also changes which chip is cheapest. Ornn estimates an open-weight mixture-of-experts model runs at $0.29 per million tokens on A100 against $0.64 on H100, and A100 occupancy rose from 74% to 90% between March and September. Old chips stay useful longer, which flattens their curves.
How to actually trade or hedge it
There are four kinds of instrument. None is yet a liquid, US-regulated future, so you will have to wait a little to actually make money off of compute.
Listed futures (pending). CME filed two contracts, on Silicon Data's H100 and B200 indexes, on 11 Aug. Each covers 730 GPU-hours, one month of one GPU. Each settles in cash on the average of the daily index over the month, with monthly contracts listed 36 months out. A one-cent move is worth $7.30. A planned 5 Oct launch slipped, and the CFTC extended its review to 9 Nov, citing "novel or complex issues". Major compute market companies have each announced contracts subject to approval.
The CFTC's request for comment closed on 20 Oct with more than 100 filings. Its chair framed the stakes: "America cannot win the AI race without a robust derivatives market for compute".
Event contracts. Since March, Kalshi has run weekly and monthly GPU price markets that settle on Ornn's index, and on 14 Jul it published forward curves built from them. They had $4.4M of notional by 27 Jul. Two days before settlement, B200 forecasts sat a median 10% from the final price. CFTC staff have stayed a Kalshi contract amendment until 19 Nov.
OTC forwards and swaps. This is where trading happens today. BGC launched a compute desk for over-the-counter deals in June. In October, Jump Trading set up a compute desk led by the team from compute-hedging start-up Itô markets. A dealer quoting both sides needs inventory and a balance sheet to warehouse multi-year risk. That is why desks sit inside large trading firms.
The physical contract itself. A reservation is a forward with physical delivery. It hedges price perfectly for that provider’s hardware, but carries the provider’s credit risk. Resale is starting to appear: SF Compute runs an order book where tenants resell reserved capacity they don’t need. Every listed contract above settles in cash against an index instead, swapping delivery risk for basis risk.
Three mechanics to understand before any of these:
-
Averaging. Monthly-average settlement matches how you consume compute, hour by hour. It also makes the price harder to push around on expiry day. Power markets settle the same way.
-
Basis and hedge ratio. A contract pays on the index; you pay your provider. The textbook minimum-variance ratio is h = ρ × σ(your price) ÷ σ(index): the correlation between your price and the index, scaled by their relative volatility. Low correlation means a weak hedge however many contracts you hold. Over the month to 24 Oct, daily moves in Silicon Data's and Ornn's H100 indexes barely moved together; the correlation was near zero to negative depending on how you count days (my calc, end note). One month is too short to estimate a hedge ratio, but it shows how big basis can be. Monthly averaging helps, because levels trended together even when daily moves did not.
-
Counterparty and margin. Futures move credit risk to a clearing house and require daily margin. OTC deals and reservations keep credit risk bilateral. Perpetual futures need continuous margin, which most GPU operators cannot fund.
The hedgers with the most to gain are the ones who borrow. One GPU provider told the CFTC that GPU lenders today underwrite against unhedged rental rates, unlike oil and gas lenders, who require hedges. If a listed contract arrives, the first big change may be in how GPUs are financed, not how they are rented.
Hayek (1945) talking about tin prices. If tin gets scarce, users do not need to know why. The price rises, and they economise. What matters, he wrote, is "how little the individual participants need to know in order to be able to take the right action".
A compute index does the same job. An engineer moving a batch job to an A100 does not need to know about a glass-cloth shortage in Japan or a grid queue in Virginia. The price already carries that news. The open question is which of today's indexes wins the trust to settle contracts and who makes money betting there.
Personal views only. Not affiliated with or endorsed by IOSG/IOSF Ventures. Not investment advice.
Sources, in order of appearance. my guy Aristotle, Politics 1259a; Silicon Data H100 index; Ornn markets; Bloomberg via Edward Conard, CoreWeave CDS; NVIDIA DGX H100 datasheet; NVIDIA DGX B200 datasheet; EIA electricity prices; CBRE via DCD, 24 Jun 2026; Uptime Institute 2025 survey; Epoch AI cluster costs; Kalshi whitepaper, Oct 2026; CoreWeave 10-K; Meta 10-K; Amazon 10-K; Nebius 20-F; Microsoft K80 retirement; Microsoft V100 retirement; NVIDIA DGX A100 datasheet; Ornn, The Economics of Open-Weight Inference; Hyperbolic comment to the CFTC; Ornn H100 index; Price of Compute methodology; Price of Compute; Silicon Data B300; Price of Compute B300; Lambda pricing; Nebius pricing; CoreWeave pricing; Silicon Data on the H100 price spike; FourWeekMBA on Nebius pricing; Together AI pricing; Hot Aisle reply on X; Bessembinder and Lemmon (2002); Alan Chang on X; Silicon Data B200; Ornn B200; Ornn on headlines; CoreWeave 10-Q, Jun 2026; Enron 1999 annual report; Light Reading, 29 Nov 2001; Channel Futures; Epoch AI on chip supply constraints; Micron Q4 FY26 remarks; Reuters via Kitco on transformers; LBNL interconnection queues; TrendForce on Nittobo; CTEE, 23 May 2026; Epoch AI on B200 cost; PJM, Jul 2026; PJM, Dec 2025; CBRE H1 2026; S&P Global on the ERCOT price cap; CoreWeave 10-Q, Sep 2025; Stanford AI Index 2025; Google, May 2026; Jevons, The Coal Question; CME filing; Finance Magnates; TokenPost; ICE and Ornn; Nodal and Compute Desk; Architect via pulse2; CFTC Release 9286-26; CFTC docket CFTC-2026-1850; Kalshi forward curves, BusinessWire; Benzinga via Yahoo on Kalshi; CFTC stay letter to Kalshi; Nasdaq on BGC; Crypto Briefing on Jump; SF Compute; Hayek, “The Use of Knowledge in Society”.